
Grafana 系列之统一展示Prometheus数据源
作者:东风微鸣
这篇文章主要为大家介绍了Grafana 系列之统一展示Prometheus数据源配置详解,有需要的朋友可以借鉴参考下,希望能够有所帮助,祝大家多多进步,早日升职加薪
Grafana Prometheus 数据源
系列文章
Grafana 提供了对 Prometheus 的内置支持。本文会介绍 Grafana Prometheus(也包括 Prometheus 的兼容实现,如 Thanos, Mimir 等) 数据源的部分选项、变量 (Variable)、查询 (Query) 和其他针对 Prometheus 数据源的功能。
配置 Prometheus 数据源
这里选择几项重要的部分进行说明:
URL: Prometheus Server 的 URL, 示例为:http://prometheus.example.org:9090(不需要 path 等信息)Manage alerts via Alerting UI: 启用后可以集成 AlertManager, Grafana 可以显示、管理 AlertManager。启用后,可以选择对应的 Prometheus AlertManager 数据源Alertmanager data source: 下拉框,选择对应的 Prometheus AlertManager 数据源
Type: Prometheus Server 的类型;包括Prometheus,Cortex,Thanos,Mimir。当选择时,版本字段会尝试使用 Prometheus buildinfo API 自动填充。一些普罗米修斯类型,如 Cortex,不支持这个 API,必须手动填入。Disable metrics lookup: 勾选该选项将禁用查询字段自动完成中的度量选择器和度量/标签支持。如果你在较大的 Prometheus 实例中遇到性能问题,这将有所帮助。Custom query parameters: 在 Prometheus 查询 URL 中添加自定义参数。例如,timeout、partial_response、dedup、或max_source_resolution。多个参数应该用&连接起来。- 如:
max_source_resolution=5m&timeout=10
- 如:
配置 Exemplars
📝Note:
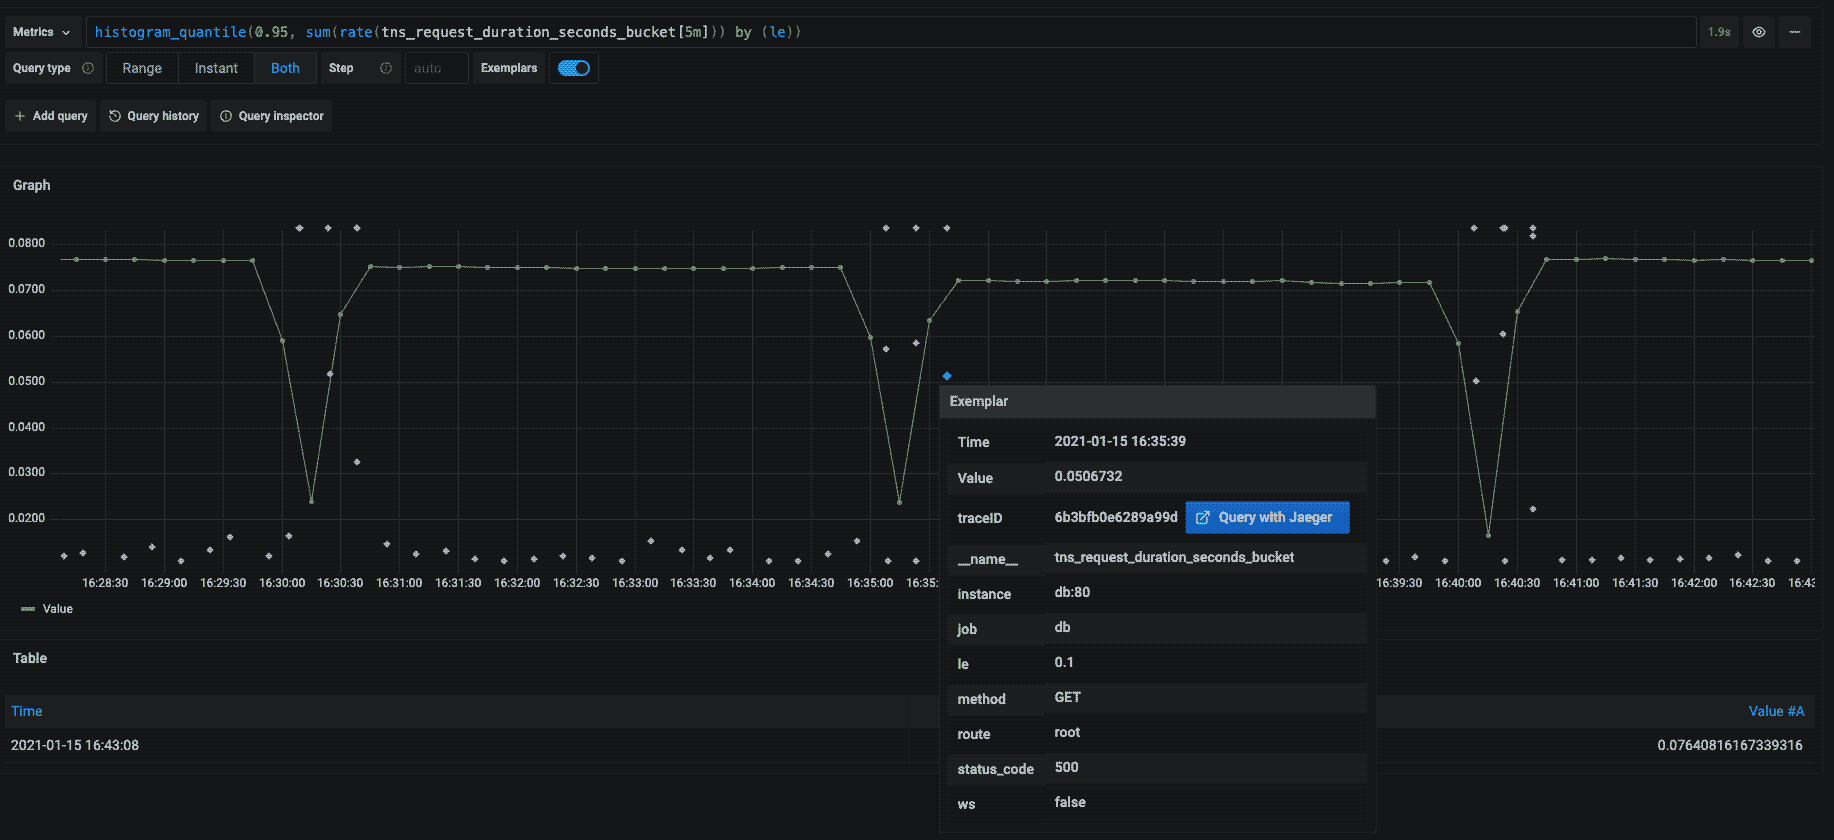
在 Prometheus v2.26 及以上版本与 Grafana v7.4 及以上版本中可用。 如 前文 所述,Exemplars 用途是用于在 Metric -> Traces 无缝跳转。
Grafana 7.4 及更高版本可以在 "Explore" 和 "Dashboards" 中显示 Exemplars 数据与指标。Exemplars 数据将来自特定事件的 higher-cardinality metadata 与传统的时间序列数据联系起来。
- Internal link: 如果你有一个内部链接,启用这个选项。启用后,这将显示数据源选择器。为你的示例数据选择后端 tracing 数据存储。如 Grafana 内部的 Tempo 数据源或 Jaeger 数据源。
- Data source: (只有当你启用 "Internal link"时才可见) 为你的示范数据选择后端追踪数据存储。
- URL: (只有当你禁用 "Internal link"时才可见) 定义了外部链接的完整 URL。你可以通过使用
${__value.raw}从该字段中插值。 - Label name: 为 exemplars 的 traceID 属性添加一个名称。
Prometheus YAML 配置示例
典型示例如下:(基于 Grafana 9)
apiVersion: 1
datasources:
  - name: Prometheus
    type: prometheus
    # Access mode - proxy (server in the UI) or direct (browser in the UI).
    access: proxy
    url: http://localhost:9090
    jsonData:
      httpMethod: POST
      manageAlerts: true
      prometheusType: Prometheus
      prometheusVersion: 2.37.0
      cacheLevel: 'High'
      exemplarTraceIdDestinations:
        # Field with internal link pointing to data source in Grafana.
        # datasourceUid value can be anything, but it should be unique across all defined data source uids.
        - datasourceUid: my_jaeger_uid
          name: traceID
        # Field with external link.
        - name: traceID
          url: 'http://localhost:3000/explore?orgId=1&left=%5B%22now-1h%22,%22now%22,%22Jaeger%22,%7B%22query%22:%22$${__value.raw}%22%7D%5D'
以上就是Grafana 系列之统一展示Prometheus数据源的详细内容,更多关于Grafana统一展示Prometheus的资料请关注脚本之家其它相关文章!