Python中rasterio库的实现
作者:Python与遥感
Rasterio是一个用于读写光栅数据的Python库,它专注于快速和可靠地处理大规模地理空间栅格数据,本文主要介绍了Python中rasterio库的实现,感兴趣的可以了解一下
前言
遥感数据是通过卫星、无人机等设备获取的地球表面信息,广泛应用于农业、环境监测、城市规划等领域。处理这些数据常常需要对栅格图像进行分析,而Python的rasterio库正是解决这一需求的利器。本篇文章将带你深入了解rasterio库,帮助你掌握遥感数据处理的技巧与最佳实践。
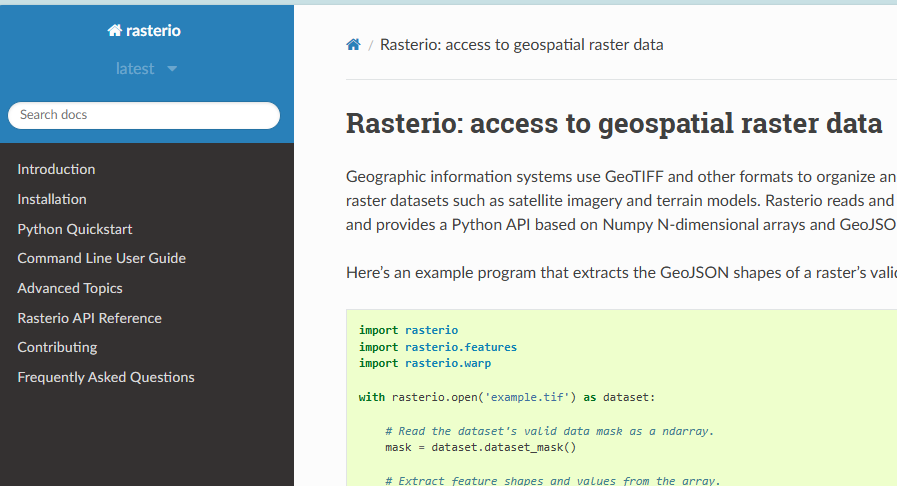
rasterio官方文档:https://rasterio.readthedocs.io/en/latest/index.html

一、rasterio库简介
rasterio是基于GDAL的Python接口封装,相比直接使用GDAL,rasterio具有以下优势:
✅ 更简洁的API设计
✅ 原生支持NumPy数组操作
✅ 完美集成Python科学计算生态
✅ 支持多线程读写加速
典型应用场景:
- 卫星影像读写与格式转换
- 遥感指数计算(如NDVI等)
- 影像裁剪与镶嵌
- 地理坐标系统转换
二、环境安装
你可以通过以下命令安装rasterio库:
pip install rasterio
对于地理空间数据处理,推荐使用conda环境来管理依赖包:
conda install -c conda-forge rasterio
注意事项:
- Windows用户:建议先安装预编译的GDAL库,避免出现安装错误。可以从https://www.lfd.uci.edu/~gohlke/pythonlibs/下载对应版本的whl文件。
- Linux/MacOS用户:通常直接通过
pip或conda安装即可,但请确保GDAL等依赖项已正确配置。
三、核心功能详解
1. 数据读取与元数据解析
import rasterio

with rasterio.open('sentinel2.tif') as src:
    # 获取数据矩阵(NumPy数组)
    data = src.read()

    # 查看元数据
    print(f"数据集信息:\n{src.meta}")
    print(f"坐标系:{src.crs}")
    print(f"影像尺寸:{src.width}x{src.height}")
    print(f"空间分辨率:{src.res}")
    print(f"地理范围:{src.bounds}")
2. 数据写入与格式转换
# 创建新栅格文件
profile = src.profile
profile.update(
    dtype=rasterio.float32,
    count=3,
    compress='lzw'
)

with rasterio.open('output.tif', 'w', **profile) as dst:
    dst.write(data.astype(rasterio.float32))
支持格式:GeoTIFF、JPEG2000、ENVI、HDF等30+种格式
3. 数据操作技巧
▶ 影像裁剪
from rasterio.mask import mask
import geojson

# 按像素范围裁剪
window = Window(100, 200, 800, 600)
clip_data = src.read(window=window)

# 按地理范围裁剪,GeoJSON格式
geometry = {
    "type": "Polygon",
    "coordinates": [
        [
            [116.0, 39.5],
            [116.5, 39.5],
            [116.5, 40.0],
            [116.0, 40.0],
            [116.0, 39.5]
        ]
    ]
}

clip_data, clip_transform = rasterio.mask.mask(src, [geometry], crop=True)
▶ 重采样
from rasterio.enums import Resampling

# 选择重采样方法:最近邻、双线性、立方卷积等
resampled_data = src.read(
    out_shape=(src.height//2, src.width//2),
    resampling=Resampling.bilinear  # 双线性插值法
)
4. 坐标转换
# 地理坐标 ↔ 像素坐标
row, col = src.index(116.3974, 39.9093)  # 天安门坐标转像素位置
lon, lat = src.xy(500, 500)  # 中心点坐标

# 坐标系统转换
from rasterio.warp import transform
dst_crs = 'EPSG:3857'  # Web墨卡托
transformed = transform(src.crs, dst_crs, [lon], [lat])
5. 多波段处理
# 波段合并
with rasterio.open('RGB.tif', 'w', **profile) as dst:
    for i in range(3):
        dst.write(data[i], i+1)

# 计算NDVI
red = src.read(3).astype(float)
nir = src.read(4).astype(float)
ndvi = (nir - red) / (nir + red + 1e-8)
四、可视化实践
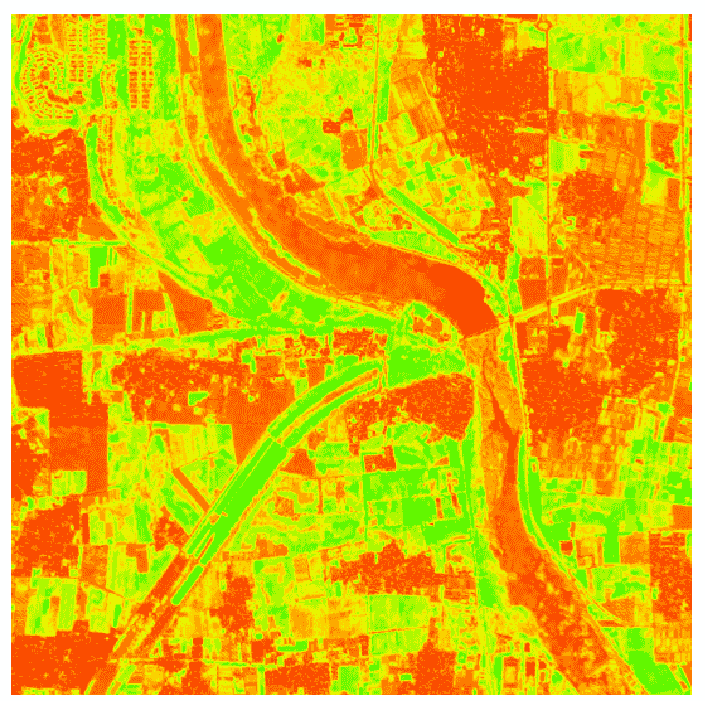
# 可视化NDVI
import matplotlib.pyplot as plt

plt.figure(figsize=(12, 8))
plt.imshow(ndvi, cmap='RdYlGn', vmin=-1, vmax=1)
plt.colorbar(label='NDVI')
plt.title('植被指数分布', fontsize=16)
plt.axis('off')
plt.savefig('ndvi_map.png', dpi=300, bbox_inches='tight')

五、实际应用案例
任务:批量处理Landsat8数据提取水体信息
# 示例:批量处理Landsat8数据提取水体信息

# 1. 读取热红外波段
with rasterio.open('landsat8_b10.tif') as src:
    thermal_band = src.read(1)

# 2. 计算地表温度(简单的示例,实际需要进行辐射校正)
temperature = (thermal_band - 273.15)  # 假设热红外波段已经是开尔文温度

# 3. 应用阈值分割提取水体(基于温度或植被指数)
water_mask = temperature < 20  # 假设温度低于20°C为水体

# 4. 输出二值化结果
with rasterio.open('water_mask.tif', 'w', **src.profile) as dst:
    dst.write(water_mask.astype(rasterio.uint8), 1)

# 5. 生成统计报告
import numpy as np
water_area = np.sum(water_mask) * src.res[0] * src.res[1]  # 计算水体面积
print(f'水体面积: {water_area} 平方米')
六、高级功能
- 多线程处理:通过
rasterio.Env()配置GDAL线程数
from rasterio import Env

with Env(GDAL_NUM_THREADS=4):
    with rasterio.open('large_image.tif') as src:
        data = src.read()
- 内存文件操作:使用
MemoryFile处理临时数据 - 数据集拼接:利用
rasterio.merge.merge()实现影像镶嵌 - 分块处理:支持大数据分块读取(chunked reading)
结语
rasterio凭借其简洁的API和强大的功能,已成为遥感数据处理的必备工具。
到此这篇关于Python中rasterio库的实现的文章就介绍到这了,更多相关Python rasterio库内容请搜索脚本之家以前的文章或继续浏览下面的相关文章希望大家以后多多支持脚本之家!
