
python Seaborn绘制统计图全面指南(直方图散点图小提琴图热力图相关系数图多张合并)
作者:用户007 Python学习杂记
seaborn基础使用
先看一一个简单案例,
# 导入库
import seaborn as sns
# 设置基本的配置
sns.set_theme()
# 导入数据
tips = sns.load_dataset("tips")
# 可视化
sns.relplot(
    data=tips,
    x="total_bill", y="tip", col="time",
    hue="smoker", style="smoker", size="size",
)

以上是用的seaborn自带的样例数据,该数据需要开魔法,全局代理才能导入。如果无法导入数据,也可以自己参照数据编写样本数据。数据样式如下:

直方图
可视化分布的最常见方法是直方图。直方图是一个条形图,其中表示数据变量的轴被划分为一组离散条柱,并且使用相应条形的高度显示落在每个条柱内的观测值计数:
penguins = sns.load_dataset("penguins")
sns.displot(penguins, x="flipper_length_mm")

也可以设置直方图的宽度。
sns.displot(penguins, x="flipper_length_mm", binwidth=3)

散点图
散点图是指在回归分析中,数据点在直角坐标系平面上的分布图,散点图表示因变量随自变量而变化的大致趋势,据此可以选择合适的函数对数据点进行拟合。
import seaborn as sns
sns.set_theme(style="white")

# Load the example mpg dataset
mpg = sns.load_dataset("mpg")

# Plot miles per gallon against horsepower with other semantics
sns.relplot(x="horsepower", y="mpg", hue="origin", size="weight",
            sizes=(40, 400), alpha=.5, palette="muted",
            height=6, data=mpg)

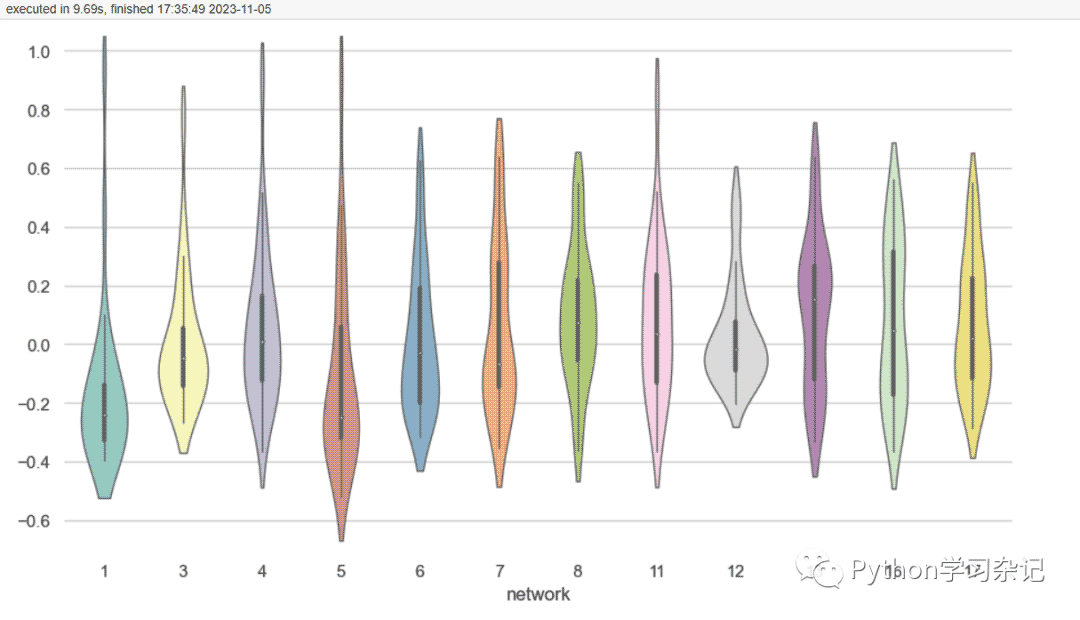
小提琴图
小提琴图(violin plot)是一种用于可视化数值数据分布情况的图表类型,它结合了箱线图和核密度图的优点。小提琴图通常用于比较多个组之间的分布差异,或者显示一个变量在不同类别下的分布情况。
小提琴图的外形类似于小提琴,中间部分是数据的密度估计曲线,两侧是箱线图或者散点图。小提琴图的横轴通常表示变量或者组别,纵轴表示数值变量的取值范围。每个小提琴图的宽度相同,高度表示数据的密度分布情况。
小提琴图中的箱线图表示数据的五数概括(最小值、下四分位数、中位数、上四分位数、最大值),箱线图两侧的线条表示数据的范围。如果需要比较多个组之间的分布差异,可以将它们放在同一个小提琴图上进行比较。如果需要显示一个变量在不同类别下的分布情况,可以将它们分别画在不同的小提琴图中进行比较。
import seaborn as sns
import matplotlib.pyplot as plt
sns.set_theme(style="whitegrid")

# Load the example dataset of brain network correlations
df = sns.load_dataset("brain_networks", header=[0, 1, 2], index_col=0)

# Pull out a specific subset of networks
used_networks = [1, 3, 4, 5, 6, 7, 8, 11, 12, 13, 16, 17]
used_columns = (df.columns.get_level_values("network")
                          .astype(int)
                          .isin(used_networks))
df = df.loc[:, used_columns]

# Compute the correlation matrix and average over networks
corr_df = df.corr().groupby(level="network").mean()
corr_df.index = corr_df.index.astype(int)
corr_df = corr_df.sort_index().T

# Set up the matplotlib figure
f, ax = plt.subplots(figsize=(11, 6))

# Draw a violinplot with a narrower bandwidth than the default
sns.violinplot(data=corr_df, bw_adjust=.5, cut=1, linewidth=1, palette="Set3")

# Finalize the figure
ax.set(ylim=(-.7, 1.05))
sns.despine(left=True, bottom=True)
热力图
import matplotlib.pyplot as plt
import seaborn as sns
sns.set_theme()

# Load the example flights dataset and convert to long-form
flights_long = sns.load_dataset("flights")
flights = (
    flights_long
    .pivot(index="month", columns="year", values="passengers")
)

# Draw a heatmap with the numeric values in each cell
f, ax = plt.subplots(figsize=(9, 6))
sns.heatmap(flights, annot=True, fmt="d", linewidths=.5, ax=ax)

相关系数图
相关系数是最早由统计学家卡尔·皮尔逊设计的统计指标,是研究变量之间线性相关程度的量,一般用字母r表示。取值范围为-1到1,小于0位负相关,大于0为正相关。
import pandas as pd
import seaborn as sns
sns.set_theme()

# Load the brain networks example dataset
df = sns.load_dataset("brain_networks", header=[0, 1, 2], index_col=0)

# Select a subset of the networks
used_networks = [1, 5, 6, 7, 8, 12, 13, 17]
used_columns = (df.columns.get_level_values("network")
                          .astype(int)
                          .isin(used_networks))
df = df.loc[:, used_columns]

# Create a categorical palette to identify the networks
network_pal = sns.husl_palette(8, s=.45)
network_lut = dict(zip(map(str, used_networks), network_pal))

# Convert the palette to vectors that will be drawn on the side of the matrix
networks = df.columns.get_level_values("network")
network_colors = pd.Series(networks, index=df.columns).map(network_lut)

# Draw the full plot
g = sns.clustermap(df.corr(), center=0, cmap="vlag",
                   row_colors=network_colors, col_colors=network_colors,
                   dendrogram_ratio=(.1, .2),
                   cbar_pos=(.02, .32, .03, .2),
                   linewidths=.75, figsize=(12, 13))

g.ax_row_dendrogram.remove()

多张图合并
有时候需要一次画多个图,需要用到FacetGrid模块。
import numpy as np
import pandas as pd
import seaborn as sns

sns.set_theme()

# Generate an example radial datast
r = np.linspace(0, 10, num=100)
df = pd.DataFrame({'r': r, 'slow': r, 'medium': 2 * r, 'fast': 4 * r})

# Convert the dataframe to long-form or "tidy" format
df = pd.melt(df, id_vars=['r'], var_name='speed', value_name='theta')

# Set up a grid of axes with a polar projection
g = sns.FacetGrid(df, col="speed", hue="speed",
                  subplot_kws=dict(projection='polar'), height=4.5,
                  sharex=False, sharey=False, despine=False)

# Draw a scatterplot onto each axes in the grid
g.map(sns.scatterplot, "theta", "r")

以上就是python Seaborn绘制统计图全面指南的详细内容,更多关于python Seaborn绘制统计图的资料请关注脚本之家其它相关文章!