
Matplotlib多子图使用一个图例的实现
作者:Threetiff
多子图是Matplotlib中的一个功能,可以在同一图形中创建多个子图,本文主要介绍了Matplotlib多子图使用一个图例的实现,感兴趣的可以了解一下
1 所有子图的图例相同
利用函数 fig.axe.get_legend_handles_labels() 得到图的 line 和 label
import matplotlib.pyplot as plt
fig = plt.figure()
axes = fig.subplots(nrows=2, ncols=2)
for ax in fig.axes:
    ax.plot([0, 10], [0, 10], label='linear')
# 使用最后一个子图的图例
lines, labels = fig.axes[-1].get_legend_handles_labels()
fig.legend(lines, labels, loc = 'upper center') # 图例的位置,bbox_to_anchor=(0.5, 0.92),
plt.show()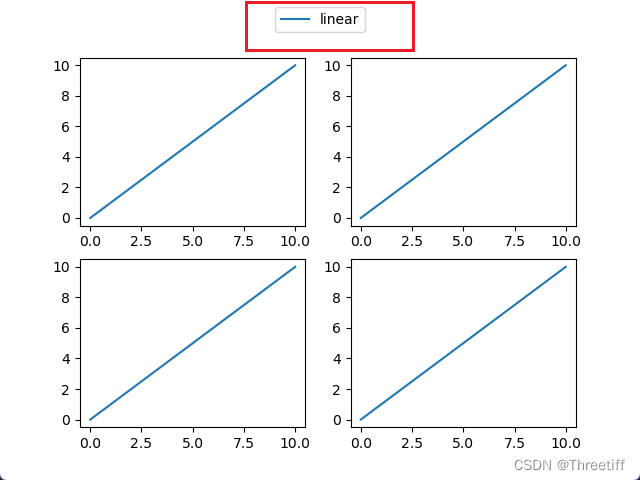
2 所有的子图图例不同
import matplotlib.pyplot as plt
import numpy as np
x = np.linspace(0, 10, 501)
fig = plt.figure()
axes = fig.subplots(nrows=2, ncols=2)
axes[0, 0].plot(x,np.sin(x),color = 'k',label="sin(x)")
axes[0, 1].plot(x,np.cos(x),color = 'b',label="cos(x)")
axes[1, 0].plot(x,np.sin(x) + np.cos(x),color = 'r',label="sin(x)+cos(x)")
axes[1, 1].plot(x,np.sin(x) - np.cos(x),color = 'm',label="sin(x)-cos(x)")
lines = []
labels = []
# 利用循环得到每一个子图的图例
for ax in fig.axes:
    axLine, axLabel = ax.get_legend_handles_labels()
    lines.extend(axLine)
    labels.extend(axLabel)
fig.legend(lines, labels, loc = 'upper right')  # 图例的位置,bbox_to_anchor=(0.5, 0.92),
plt.show()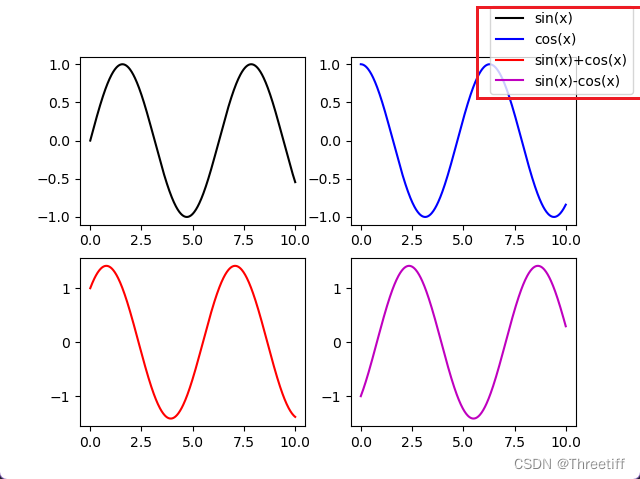
参考链接
到此这篇关于Matplotlib多子图使用一个图例的实现的文章就介绍到这了,更多相关Matplotlib多子图内容请搜索脚本之家以前的文章或继续浏览下面的相关文章希望大家以后多多支持脚本之家!