Python中subplots_adjust函数的用法
作者:lty_sky
Python中subplots_adjust函数
subplots_adjust(self, left=None, bottom=None, right=None, top=None, wspace=None, hspace=None)
参数含义
left, right, bottom, top:子图所在区域的边界。
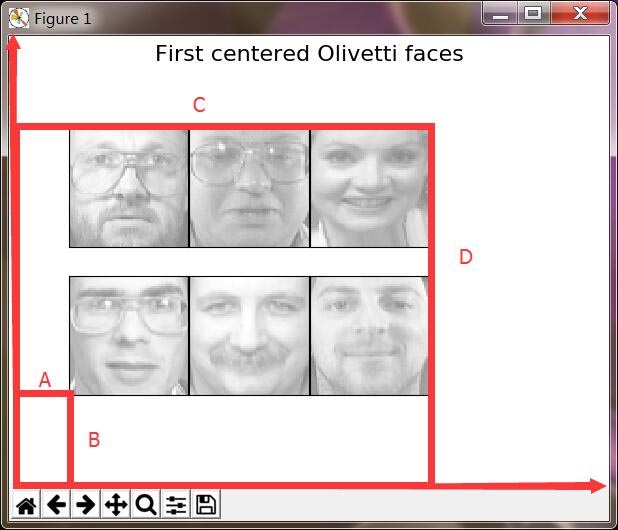
当值大于1.0的时候子图会超出figure的边界从而显示不全;值不大于1.0的时候,子图会自动分布在一个矩形区域(下图灰色部分)。
要保证left < right, bottom < top,否则会报错。
使用subplots_adjust一般会传入6个参数,我们分别用A,B,C,D,E,F表示。
然后我们对图框建立坐标系,将坐标轴原点定在左下角点,并将整个图框归一化,即横纵坐标都是0到1之间。
从下图中可以看出前四个参数所代表的距离

A,B可以理解是图像左下角点的坐标,C,D可以理解为图像右上角点的坐标,至于E,F则是控制子图之间的距离。
注意这些值都是0到1之间的值,代表百分比。
python绘图子图间距调整:subplots_adjust
官网注释:
我是个初学者,个人认为不懂的可以先看看官网的文档,再去百度什么的,理解别人的代码。
matplotlib.pyplot.subplots_adjust(函数名)
matplotlib.pyplot.subplots_adjust(left=None, bottom=None, right=None,
top=None, wspace=None, hspace=None)
(前四个含义——单独子图的参数调整:左、下、右、上预留距离,默认为无。)
(后两个含义——子图之间的参数调整:横向间隔距离、纵向间隔距离)
Adjust the subplot layoutparameters.(用途:子图布局参数调整)
Unset parameters are left unmodified;
initial values are given by rcParams[“figure.subplot.[name]”].
(未设置的参数保持不变;初始值由 给出 rcParams[“figure.subplot.[name]”]。)
这里涉及到 rcParams的设置,我也不太懂,可以设置字体语言和样式这些,比如:
plt.rcParams[‘font.sans-serif'] =[‘Microsoft YaHei']
plt.rcParams[‘axes.unicode_minus'] = False)
参数的官网解释
1.Parameters leftfloat, optional The position of the left edge of the subplots, as a fraction of the figure width.
左:浮点数,可选子图左边缘的位置,作为图形宽度的一部分。
2. rightfloat, optional The position of the right edge of the subplots, as a fraction of the figure width.
右:浮点数,可选子图右边缘的位置,作为图形宽度的一部分。
3. bottomfloat, optional The position of the bottom edge of the subplots, as a fraction of the figure height.
底部:浮点数,可选子图底部边缘的位置,作为图形高度的一部分。
4. topfloat, optional The position of the top edge of the subplots, as a fraction of the figure height.
顶部:浮点数,可选子图上边缘的位置,作为图形高度的一部分。
5.wspacefloat, optional The width of the padding between subplots, as a fraction of the average Axes width.
wspace:浮点数,可选子图之间的填充宽度,作为平均轴宽度的一部分。
6.hspacefloat, optional The height of the padding between subplots, as a fraction of the average Axes height.
hspace:浮点数,可选子图之间的填充高度,作为平均轴高度的一部分。
总结
以上为个人经验,希望能给大家一个参考,也希望大家多多支持脚本之家。
