
Python绘制直方图的示例代码
作者:微小冷
本文主要介绍了如何使用Python绘制直方图,文中通过示例代码介绍的非常详细,对大家的学习或者工作具有一定的参考学习价值,需要的朋友们下面随着小编来一起学习学习吧
初步
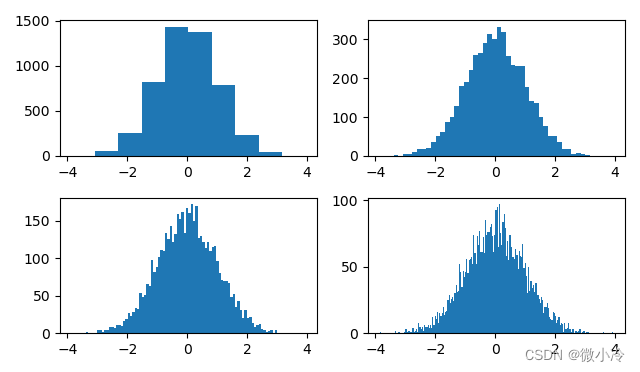
对于大量样本来说,如果想快速获知其分布特征,最方便的可视化方案就是直方图,即统计落入不同区间中的样本个数。
以正态分布为例
import numpy as np
import matplotlib.pyplot as plt
xs = np.random.normal(0, 1, size=(5000))
fig = plt.figure()
for i,b in enumerate([10, 50, 100, 200],1):
    ax = fig.add_subplot(2,2,i)
    plt.hist(xs, bins=b)
plt.show()其中bins参数用于调控区间个数,出图结果如下
参数
直方图函数的定义如下
hist(x, bins=None, range=None, density=False, weights=None, cumulative=False, bottom=None, histtype='bar', align='mid', orientation='vertical', rwidth=None, log=False, color=None, label=None, stacked=False, *, data=None, **kwargs)
除了x和bins之外,其他参数含义为
- range 绘图区间,默认将样本所有范围纳入其中
- density 为
True时,纵坐标单位是占比 - weights 与
x个数相同,表示每个值所占权重 - cumulative 为
True时,将采取累加模式 - bottom y轴起点,有了这个,可以对直方图进行堆叠
- histtype 绘图类型
- align 对其方式,可选left, mid, right三种,代表左中右
- oritentation 绘制方向,可选vertical和horizontal两种
- rwitdth 数据条宽度
- log 为
True时,开启对数坐标 - color, label 颜色,标签
- stacked
绘图类型
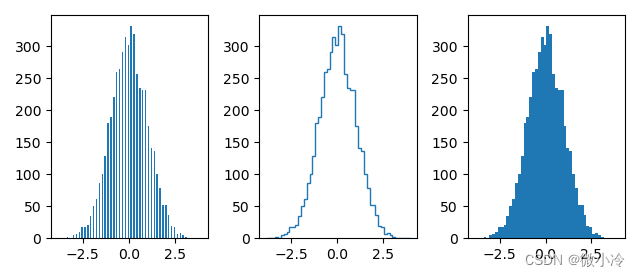
histtype共有4个选项,分别是bar, barstacked, step以及stepfilled,其中barstacked表示堆叠,下面对另外三种参数进行演示
types = ['bar', 'step', 'stepfilled']
fig = plt.figure()
for i,t in enumerate(types,1):
    ax = fig.add_subplot(1,3,i)
    plt.hist(xs, bins=50, histtype=t, rwidth=0.5)
plt.show()
效果如下
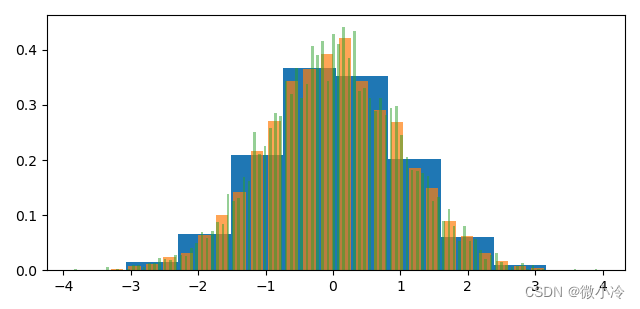
堆叠直方图,就是把多个直方图叠在一起
bins = [10, 30, 100]
ws = [1, 0.7, 0.5]
for b,w in zip(bins, ws):
    print(b,w)
    plt.hist(xs, bins=b, density=True,
        histtype='barstacked', rwidth = w, alpha=w)
plt.show()
效果如下
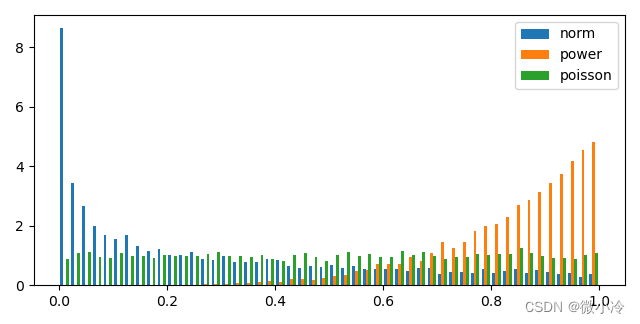
多组数据直方图对比
直方图中设置了rwidth选项,这意味着可以通过合理安排数据条宽度,以实现多组数据直方图在一个图像中更加
N = 10000
labels = ["norm", "power", "poisson"]
data = np.array([
    np.random.normal(0, 1, size=N)**2,
    np.random.power(5, size=N),
    np.random.uniform(0, 1, size=N)
]).T
plt.hist(data, 50, density=True, range=(0,1), label=labels)
plt.legend()
plt.show()其中,data为3组统计数据,hist函数会自行规划画布,效果如下
到此这篇关于Python绘制直方图的示例代码的文章就介绍到这了,更多相关Python绘制直方图内容请搜索脚本之家以前的文章或继续浏览下面的相关文章希望大家以后多多支持脚本之家!