使用Matplotlib制作动态图的示例详解
作者:哆啦A梦PLUS
一、简介
matplotlib(https://matplotlib.org/)是一个著名的python绘图库,由于其灵活强大的绘图功能使得在python中可视化变得非常容易,关于matplotlib的基础知识这里不再介绍,有疑问可以去官网翻Tutorials和example学习。由于我们实际使用时常常是绘制静态图,忽略了matplotlib的动态图生成功能,同时matplotlib生成动态图的功能不是非常友善,因此大部分人在真的需要制作动态图时都会选择先用matplotlib生成一系列静态图片,然后再用其它相对比较容易使用的第三方python库生成动态图,如imageio(https://imageio.readthedocs.io/en/stable/#), 或者使用其它工具,如Matlab。这里打算简单介绍一下在matplotlib库中制作动态图的方法。
二、模块简介
matplotlib的animation模块提供了动态图制作功能,animation类提供了两个方法来生成动态图,即FuncAnimation和ArtistAnimation,这里我们使用FuncAnimation方法重复调用函数来生成图片。
1. FuncAnimation类介绍
FuncAnimation类的主要参数包括:
fig: 每一帧画面绘制使得Figure对象
func: 定义动画每一帧的更新函数,通常这一函数需要包含额外参数,此时可以用functools.partial来生成。
frames:可以是可迭代对象,整数,或者生成函数或者缺省。
init_func:初始化函数
inteval:每一帧画面的停留时间
repeat:当动态图中所有帧都播放完了之后是否重复播放
bilt:是否使用blitting来优化绘图
…
2. 定义动画更新函数
在FunAnimation类中,更新函数在每一帧中都会被重新调用,通过在更新函数中更改一些绘图函数的数据,在每一帧我们就能得到不同的图片,然后FunAnimation的Writer(后端)将这些图片组合就能得到动态图片。关于更新函数的一些需要注意的地方是:
如果设置了bilt == True,更新函数的最后就需要返回所有被修改或创建的Artists的引用变量
生成函数的第一个传入参数必须是当前的帧数,其具体值可以通过frames参数定义,可以是可迭代类型或整数
三、使用matplotlib制作动画
1.一步法制作动态图片
由于matplotlib本身自带强大的绘图功能,因此我们可以不用生成图片,直接在初始绘图的基础上通过更新函数来修改绘图数据,一步直接生成动态图片,方便快捷,以下是代码:
import numpy as np
from matplotlib.animation import FuncAnimation
import matplotlib.pyplot as plt
from functools import partial
### 绘制y=sin(2pi(x+t/t_0))*sin(2pi(t/t_0))
def getSinx_t(t=0, t_0=120, x_count=1e5):
    x = np.linspace(0.0, 1.0, int(x_count))
    y = np.sin(2.0*np.pi*(x + t/t_0))*np.sin(t/t_0*2.0*np.pi)
    return x, y
### 图片初始化
fig, ax = plt.subplots(dpi=100)
ax.set_aspect('auto')
ax.set_xlim((0.0, 1.0))
ax.set_ylim((-1.0, 1.0))
ax.set_xlabel('x')
ax.set_ylabel('y')
ax.set_title(r'$y=sin[2\pi(x+t/t_0)]*sin(2\pi t/t_0)$')
### 绘制初始曲线
x, y = getSinx_t()
y_up = y[np.where(y>0)]
x_up = x[np.where(y>0)]
x_dn = x[np.where(y<0)]
y_dn = y[np.where(y<0)]
plot_line = ax.plot(x, y)
plot_hline = ax.hlines(y=0.0, xmin=0.0, xmax=1.0, linestyles='dashed', colors='grey')
fill_xy_up = ax.fill_between(x=x_up, y1=y_up, y2=0, color='red', alpha=0.3)
fill_xy_dn = ax.fill_between(x=x_dn, y1=y_dn, y2=0, color='green', alpha=0.3)
plot_text = ax.text(x=0.8, y=0.75, s='t=0', fontsize=16, fontfamily='cursive')
### 定义动画更新函数
def UpdateFigure(num, f_plot_line, f_fill_xy_up, f_fill_xy_dn, f_plot_text):
    x_update, y_update = getSinx_t(t=num)
    f_plot_line[0].set_data(x_update, y_update)
    f_plot_text.set_text('t={}'.format(num))
    x_up = x_update[np.where(y_update>0)]
    y_up = y_update[np.where(y_update>0)]
    xy_up1 = np.column_stack((x_up, y_up))
    xy_up2 = np.column_stack((x_up[::-1], np.zeros(x_up.shape)))
    x_dn = x_update[np.where(y_update<0)]
    y_dn = y_update[np.where(y_update<0)]
    xy_dn1 = np.column_stack((x_dn, y_dn))
    xy_dn2 = np.column_stack((x_dn[::-1], np.zeros(x_dn.shape)))
    f_fill_xy_up.set_verts([np.vstack((xy_up1, xy_up2))])
    f_fill_xy_dn.set_verts([np.vstack((xy_dn1, xy_dn2))])
    return [f_plot_line[0], f_fill_xy_up, f_fill_xy_dn, f_plot_text]
### 创建FunAnimation对象
ani = FuncAnimation(fig, partial(
        UpdateFigure,
        f_plot_line=plot_line,
        f_fill_xy_up=fill_xy_up,
        f_fill_xy_dn=fill_xy_dn,
        f_plot_text=plot_text),
    np.arange(120),
    blit=True)
### 保存动态图片
ani.save('sinxt.gif', fps=60)
以下为得到的动态图片:

2. 两步法制作动态图片
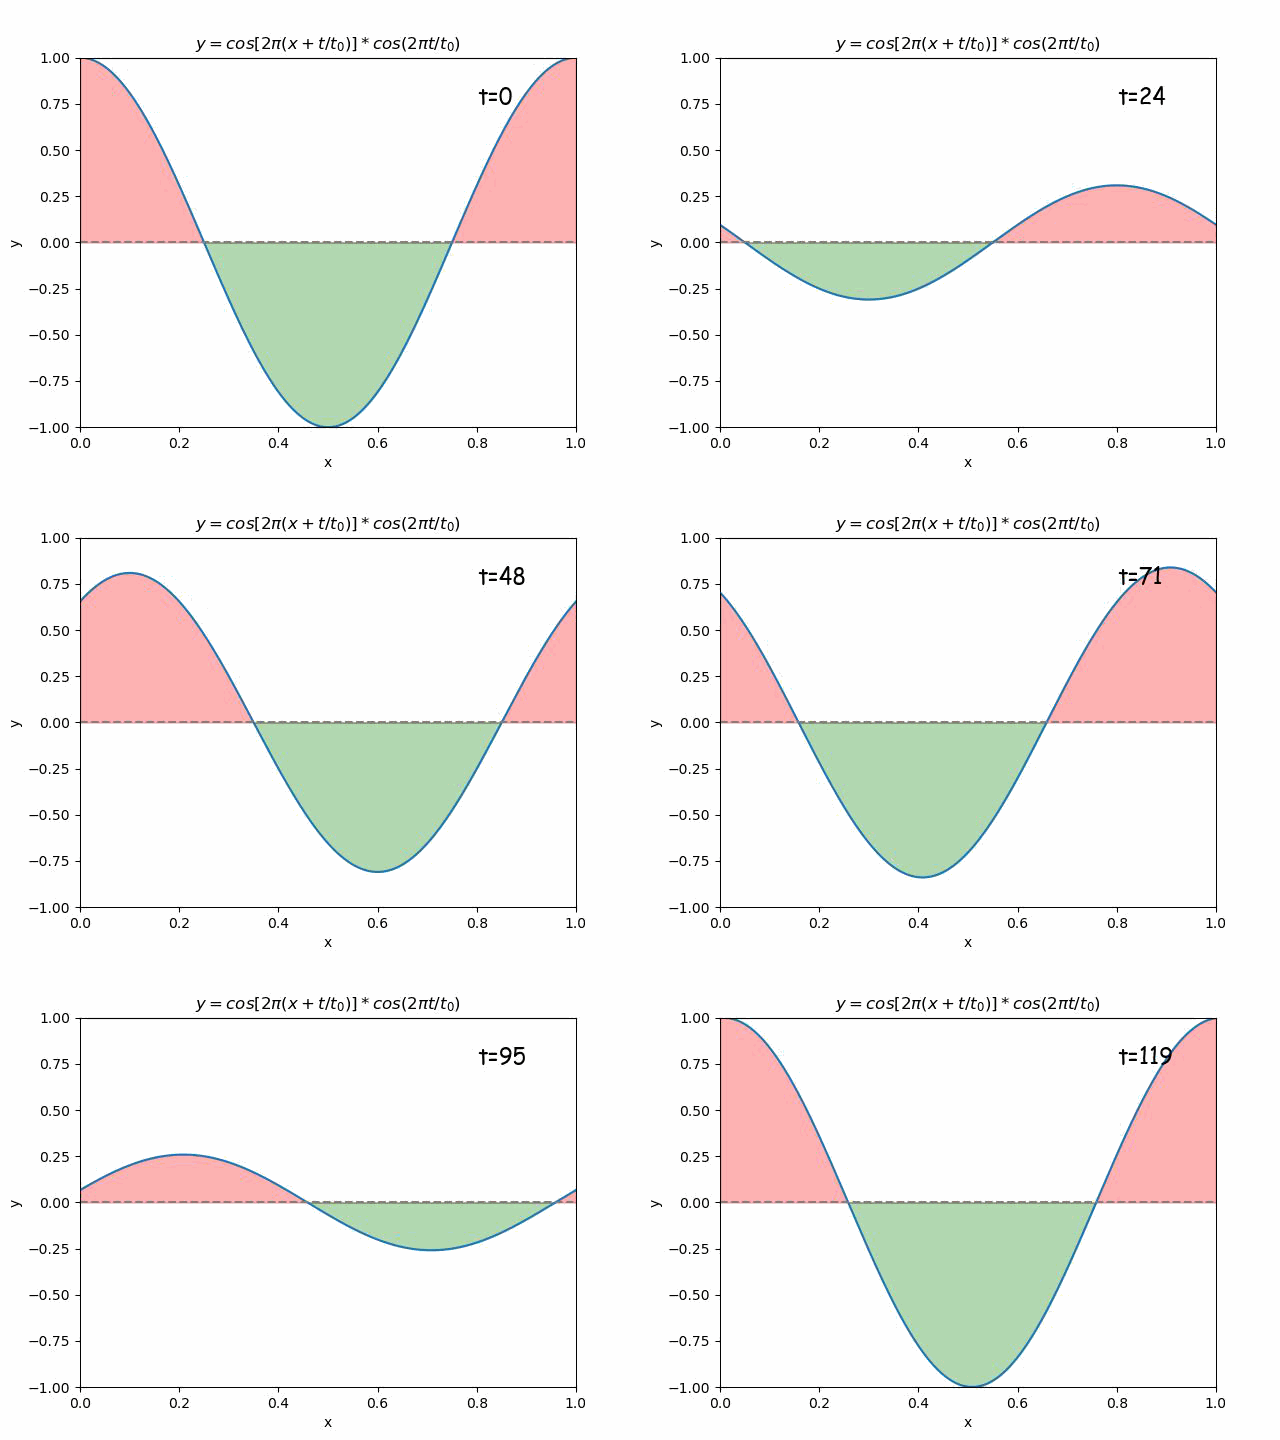
所谓两步法是指,首先用matplotlib生成一系列静态图片,然后结合matplotlib.image.imread读取图片功能和matplotlib.axes.Axes.imshow展示图片功能,来动态地更新图片,这种方法相比于上一种方法稍微复杂,但是这种方法灵活性更高,同时也可以用来组合一些非matplotlib生成的图片。以下为代码:
import matplotlib.pyplot as plt
import matplotlib.image as mimg
from matplotlib.animation import FuncAnimation
import numpy as np
from functools import partial
import os
### 绘制y=cos(2pi(x+t/t_0))*cos(2pi(t/t_0))
def getCosx_t(t=0, t_0=120, x_count=1e5):
    x = np.linspace(0.0, 1.0, int(x_count))
    y = np.cos(2.0*np.pi*(x + t/t_0))*np.cos(t/t_0*2.0*np.pi)
    return x, y
fig_count = 120             # 图片总数
### 定义生成所有图片的函数
def getFigrues(fig_count):
    try:
        os.mkdir('fig')
    except FileExistsError:
        print("Dir Exist!")
    for i in range(fig_count):
        fig, ax = plt.subplots(dpi=100)
        ax.set_aspect('auto')
        ax.set_xlim((0.0, 1.0))
        ax.set_ylim((-1.0, 1.0))
        ax.set_xlabel('x')
        ax.set_ylabel('y')
        ax.set_title(r'$y=cos[2\pi(x+t/t_0)]*cos(2\pi t/t_0)$')
        x, y = getCosx_t(t=i)
        y_up = y[np.where(y>0)]
        x_up = x[np.where(y>0)]
        x_dn = x[np.where(y<0)]
        y_dn = y[np.where(y<0)]
        ax.plot(x, y)
        ax.hlines(y=0.0, xmin=0.0, xmax=1.0, linestyles='dashed', colors='grey')
        ax.fill_between(x=x_up, y1=y_up, y2=0, color='red', alpha=0.3)
        ax.fill_between(x=x_dn, y1=y_dn, y2=0, color='green', alpha=0.3)
        ax.text(x=0.8, y=0.75, s='t={}'.format(i), fontsize=16, fontfamily='cursive')
        fig.show(False)
        fig.savefig('./fig/{}.jpg'.format(i))
        plt.close(fig)
getFigrues(fig_count)
### 读取图片尺寸
def GetFigSize(fig_path='./fig/0.jpg'):
    now_img = mimg.imread(fname=fig_path)
    img_pxy = now_img.shape
    return img_pxy[1], img_pxy[0]
### 绘图初始化
img_px, img_py = GetFigSize()
img_dpi=100
fig, ax = plt.subplots(figsize=[img_px/img_dpi, img_py/img_dpi], dpi=img_dpi)
ax.set_aspect('equal')
ax.set_position([0.0, 0.0, 1.0, 1.0])
ax.set_axis_off()
plot_img = ax.imshow(X=np.zeros((img_py, img_px, 3)))
### 定义动画更新函数
def UpdateImages(num, f_plot_img):
    now_img_path = './fig/{}.jpg'.format(num)
    now_img = mimg.imread(fname=now_img_path)
    f_plot_img.set_data(now_img)
    return [f_plot_img]
### 创建FunAnimation对象
ani = FuncAnimation(
    fig, partial(UpdateImages, f_plot_img=plot_img),
    np.arange(fig_count),
    blit=True)
### 保存动态图片
ani.save('cosxt.gif', fps=60)
得到的动态图片:

到此这篇关于使用Matplotlib制作动态图的示例详解的文章就介绍到这了,更多相关Matplotlib动态图内容请搜索脚本之家以前的文章或继续浏览下面的相关文章希望大家以后多多支持脚本之家!
