
Spring中的Actuator使用详解
作者:墨城之左
1 Spring Actuator
在生产环境中运行的程序,并不总是稳定、安静、正确的,往往会遇到各式各样的现场状况,这个时候,就需要获取该程序足够多的运行状态信息,然后分析并对其进行有效管理。
Spring Boot Actuator 提供了多种特性来监控和管理应用程序,可以基于 HTTP,也可以基于 JMX。
将 actuator 依赖包添加到项目中
<dependencies>
	<dependency>
		<groupId>org.springframework.boot</groupId>
		<artifactId>spring-boot-starter-actuator</artifactId>
	</dependency>
</dependencies>
2 Endpoints
endpoint 可以理解为被管理(或被监控) 对象 ,actuator 就是通过这些 endpoint 来实现对应用程序的监控管理。
spring 提供了大量的内置 endpoint,比如 health,beans,mappings,endpoint 名称也称为 endpoint id:
| ID | 描述 | 默认开启 | JMX | WEB |
| auditevents | Exposes audit events information for the current application. | Yes | Yes | No |
| beans | Displays a complete list of all the Spring beans in your application. | Yes | Yes | No |
| caches | Exposes available caches. | Yes | Yes | No |
| conditions | Shows the conditions that were evaluated on configuration and auto-configuration classes and the reasons why they did or did not match. | Yes | Yes | No |
| configprops | Displays a collated list of all @ConfigurationProperties. | Yes | Yes | No |
| env | Exposes properties from Spring’s ConfigurableEnvironment. | Yes | Yes | No |
| flyway | Shows any Flyway database migrations that have been applied. | Yes | Yes | No |
| health | Shows application health information. | Yes | Yes | Yes |
| httptrace | Displays HTTP trace information (by default, the last 100 HTTP request-response exchanges). | Yes | Yes | No |
| info | Displays arbitrary application info. | Yes | Yes | Yes |
| integrationgraph | Shows the Spring Integration graph. | Yes | Yes | No |
| loggers | Shows and modifies the configuration of loggers in the application. | Yes | Yes | No |
| liquibase | Shows any Liquibase database migrations that have been applied. | Yes | Yes | No |
| metrics | Shows ‘metrics’ information for the current application. | Yes | Yes | No |
| mappings | Displays a collated list of all @RequestMapping paths. | Yes | Yes | No |
| scheduledtasks | Displays the scheduled tasks in your application. | Yes | Yes | No |
| sessions | Allows retrieval and deletion of user sessions from a Spring Session-backed session store. Not available when using Spring Session’s support for reactive web applications. | Yes | Yes | No |
| shutdown | Lets the application be gracefully shutdown. | No | Yes | No |
| threaddump | Performs a thread dump. | Yes | Yes | No |
对于 Web 应用,还有以下 endpoint:
| ID | 描述 | 默认开启 | JMX | WEB |
| heapdump | Returns a GZip compressed hprof heap dump file. | Yes | N/A | No |
| jolokia | Exposes JMX beans over HTTP (when Jolokia is on the classpath, not available for WebFlux). | Yes | N/A | No |
| logfile | Returns the contents of the logfile (if logging.file or logging.path properties have been set). Supports the use of the HTTP Range header to retrieve part of the log file’s content. | Yes | N/A | No |
| prometheus | Exposes metrics in a format that can be scraped by a Prometheus server. | Yes | N/A | No |
可以通过 endpoint id 来配置是否开启该 endpoint,也可以通过 management.endpoints.enabled-by-default 属性来配置改变是否默认开启的方式。
management.endpoint.shutdown.enabled=true
management.endpoints.enabled-by-default=false
management.endpoint.info.enabled=true
可以通过下面的属性修改 JMX/Web 的默认行为:
management.endpoints.jmx.exposure.include=*
management.endpoints.jmx.exposure.exclude=
management.endpoints.web.exposure.include=*
management.endpoints.web.exposure.exclude=env,beans
可以通过注解的方式来添加自定义的 Endpoint:
- @Endpoint
- @ReadOperation
- @WriteOperatino
- @DeleteOperation
例如:
@Endpoint(id = "hello")
@Service
public class HelloService{
   @ReadOperation
   public String hello(){
   	return "Hello Endpoint";
   }
}
然后通过 JConsole 可以看到新添加的 Endpoint Mbean:
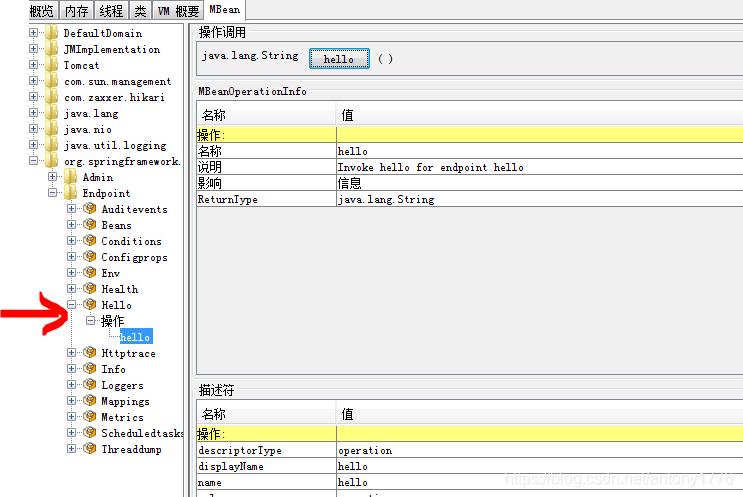
也可以通过以下 url 去访问: /actuator/jolokia/exec/org.springframework.boot:type=Endpoint,name=Hello/hello
返回结果
{
"request": {
"mbean": "org.springframework.boot:type=Endpoint,name=Hello",
"type": "exec",
"operation": "hello"
},
"value": "Hello Endpoint",
"timestamp": "xxxx",
"status": 200
}
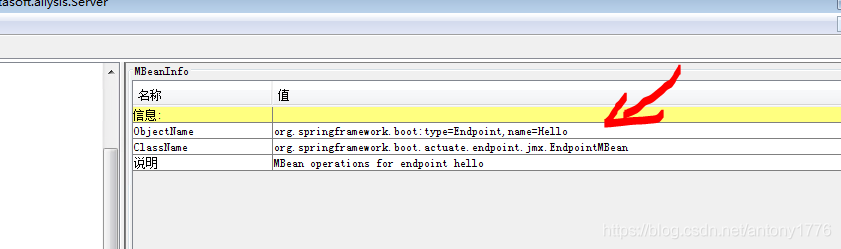
有关于 MBean 的详细信息的格式,可以通过 JConsole 查看,例如:
3 Jolokia
使用 Jolokia 可以通过 HTTP 的形式来访问 JMX Beans。
<dependency>
	<groupId>org.jolokia</groupId>
	<artifactId>jolokia-core</artifactId>
</dependency>
通过属性 management.endpoints.web.exposure.include=* 来将 /actuator/jolokia 添加到 Web Mappings 中。
4 Health
Spring Actuator 默认添加了以下 HealthIndicator:
- CassandraHealthIndicator
- CouchbaseHealthIndicator
- DiskSpaceHealthIndicator
- DataSourceHealthIndicator
- ElasticsearchHealthIndicator
- InfluxDbHealthIndicator
- JmsHealthIndicator
- MailHealthIndicator
- MongoHealthIndicator
- Neo4jHealthIndicator
- RabbitHealthIndicator
- RedisHealthIndicator
- SolrHealthIndicator
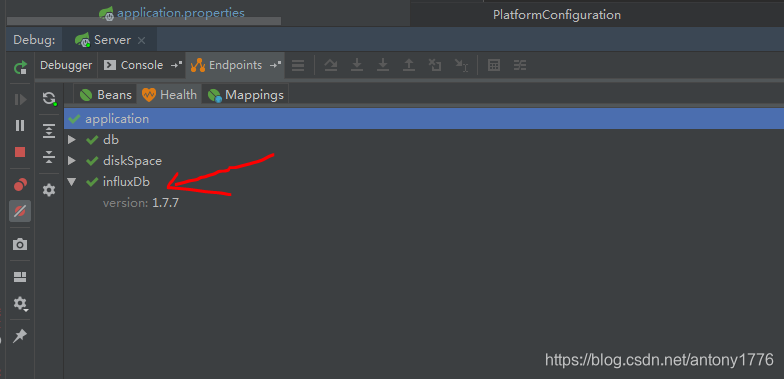
比如,当 Spring 容易中有 InfluxDB bean 时,Spring Actuator 就会自动添加对 InfluxDB health 的检测。
@Bean
public InfluxDB getInfluxDB(){
	InfluxDB db = InfluxDBFatory.connect("http://localhost:8086", "root", "root");
	db.setDatabase("mydb");
	return db;
}
会看到:
自定义 HealthIndicator 也非常的方便,比如:
@Component
public class MyHealthIndicator implements HealthIndicator {
	@Override
	public Health health() {
		int errorCode = check(); // perform some specific health check
		if (errorCode != 0) {
			return Health.down().withDetail("Error Code", errorCode).build();
		}
		return Health.up().build();
	}
}
5 Metric
Spring Boot Actuator 为 Micrometer 提供依赖管理和自动配置,Micrometer 作用应用程序指标的 facade,可以支持各种类型的监控系统,包括:
AppOptics, Atlas, Datadog, Dynatrace, Elastic, Ganglia, Humio, Influx, JMX, KairosDB, New Relic, Prometheus, SignalFx, Simple(in-memory), StatsD, Wavefront.
基本概念:
- Meter,MeterRegistry,Metric
- Meter Type: Timer,Counter,Gauge,DistributionSummary,LongTaskTimer,FunctionCounter,FuntionTimer,TImeGauge
- Tag
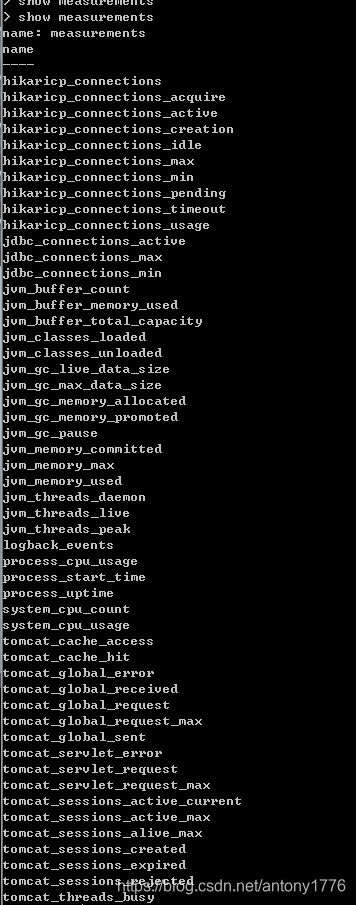
下面,将应用的指标信息都输出到 InfluxDB 数据库中,需要做以下配置:
在配置文件中,添加 micrometer-registry-influx 依赖包
<dependency>
    <groupId>io.micrometer</groupId>
    <artifactId>micrometer-registry-influx</artifactId>
</dependency>
然后再添加 InfluxmeterRegistry Bean 实例:
@Bean
public InfluxMeterRegistry getMeterRegistry(@Autowired InfluxConfig config){
	return new InfluxMeterRegistry(config, Clock.SYSTEM);
}
然后会在本地 InfluxDB 中看到以下 measurements:
Spring Boot 默认注册的指标以下几类:
- JVM metrics
- CPU metrics
- File descriptor metrics
- Kafka consumer metrics
- Logback/Log4j2 metrics
- Uptime metrics
- Tomcat metrics
- Spring Integration metrics
到此这篇关于Spring中的Actuator使用详解的文章就介绍到这了,更多相关Spring中的Actuator内容请搜索脚本之家以前的文章或继续浏览下面的相关文章希望大家以后多多支持脚本之家!