
Golang自定义开发Prometheus exporter详解
作者:台湾省委书记
1.介绍
Exporter是基于Prometheus实施的监控系统中重要的组成部分,承担数据指标的采集工作,官方的exporter列表中已经包含了常见的绝大多数的系统指标监控,比如用于机器性能监控的node_exporter, 用于网络设备监控的snmp_exporter等等。这些已有的exporter对于监控来说,仅仅需要很少的配置工作就能提供完善的数据指标采集。
prometheus四种类型的指标Counter 计数,Gauge 观测类,Histogram 直方,Summary 摘要 用golang语言如何构造这4种类型对应的指标,二是搞清楚修改指标值的场景和方式。
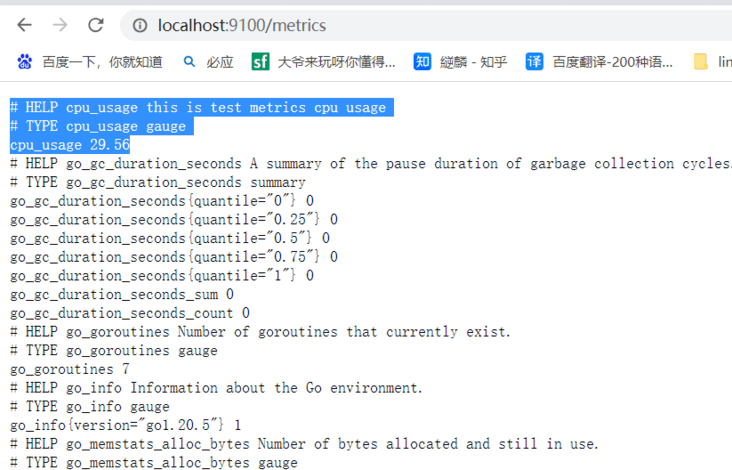
不带label的基本例子
package main
import (
"github.com/prometheus/client_golang/prometheus"
"github.com/prometheus/client_golang/prometheus/promhttp"
"net/http"
)
func main() {
// 定义指标
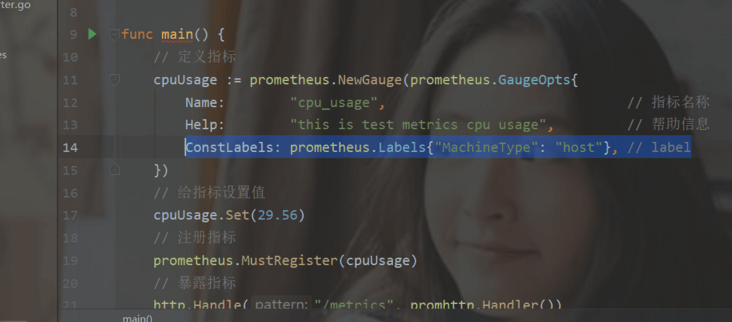
cpuUsage := prometheus.NewGauge(prometheus.GaugeOpts{
Name: "cpu_usage", // 指标名称
Help: "this is test metrics cpu usage", // 帮助信息
})
// 给指标设置值
cpuUsage.Set(29.56)
// 注册指标
prometheus.MustRegister(cpuUsage)
// 暴露指标
http.Handle("/metrics", promhttp.Handler())
http.ListenAndServe("localhost:9100", nil)
}
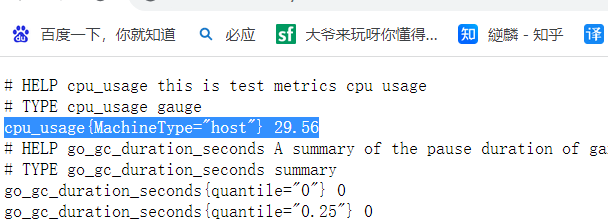
带有固定label指标的例子
带有非固定label指标的例子
package main

import (
    "github.com/prometheus/client_golang/prometheus"
    "github.com/prometheus/client_golang/prometheus/promhttp"
    "net/http"
)

func main() {
    //定义带有不固定label的指标
    mtu := prometheus.NewGaugeVec(prometheus.GaugeOpts{
        Name: "interface_mtu",
        Help: "网卡接口MTU",
    }, []string{"interface", "Machinetype"})

    // 给指标设置值
    mtu.WithLabelValues("lo", "host").Set(1500)
    mtu.WithLabelValues("ens32", "host").Set(1500)
    mtu.WithLabelValues("eth0", "host").Set(1500)

    // 注册指标
    prometheus.MustRegister(mtu)

    // 暴露指标
    http.Handle("/metrics", promhttp.Handler())
    http.ListenAndServe("localhost:9100", nil)
}
2. Counter指标类型
不带label的基本例子
package main
import (
"github.com/prometheus/client_golang/prometheus"
"github.com/prometheus/client_golang/prometheus/promhttp"
"net/http"
)
func main() {
// 定义指标
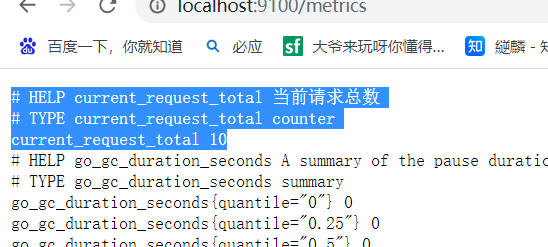
reqTotal := prometheus.NewCounter(prometheus.CounterOpts{
Name: "current_request_total",
Help: "当前请求总数",
})
// 注册指标
prometheus.MustRegister(reqTotal)
// 设置值
reqTotal.Add(10)
// 暴露指标
http.Handle("/metrics", promhttp.Handler())
http.ListenAndServe("localhost:9100", nil)
}
带有固定label指标的例子
package main
import (
"github.com/prometheus/client_golang/prometheus"
"github.com/prometheus/client_golang/prometheus/promhttp"
"net/http"
)
func main() {
// 定义指标
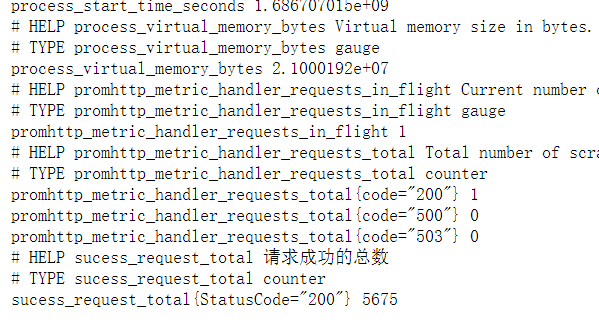
suceReqTotal := prometheus.NewCounter(prometheus.CounterOpts{
Name: "sucess_request_total",
Help: "请求成功的总数",
ConstLabels: prometheus.Labels{"StatusCode": "200"},
})
// 注册指标
prometheus.MustRegister(suceReqTotal)
// 设置值
suceReqTotal.Add(5675)
// 暴露指标
http.Handle("/metrics", promhttp.Handler())
http.ListenAndServe("localhost:9100", nil)
}
带有非固定label指标的例子
package main
import (
"github.com/prometheus/client_golang/prometheus"
"github.com/prometheus/client_golang/prometheus/promhttp"
"net/http"
)
func main() {
// 定义指标
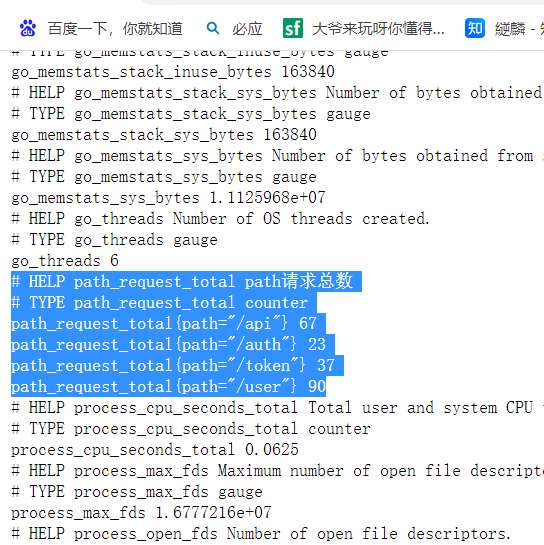
pathReqTotal := prometheus.NewCounterVec(prometheus.CounterOpts{
Name: "path_request_total",
Help: "path请求总数",
}, []string{"path"})
// 注册指标
prometheus.MustRegister(pathReqTotal)
// 设置值
pathReqTotal.WithLabelValues("/token").Add(37)
pathReqTotal.WithLabelValues("/auth").Add(23)
pathReqTotal.WithLabelValues("/user").Add(90)
pathReqTotal.WithLabelValues("/api").Add(67)
// 暴露指标
http.Handle("/metrics", promhttp.Handler())
http.ListenAndServe("localhost:9100", nil)
}
3. Histogram指标类型
不带label的基本例子
package main
import (
"github.com/prometheus/client_golang/prometheus"
"github.com/prometheus/client_golang/prometheus/promhttp"
"net/http"
)
func main() {
// 定义指标
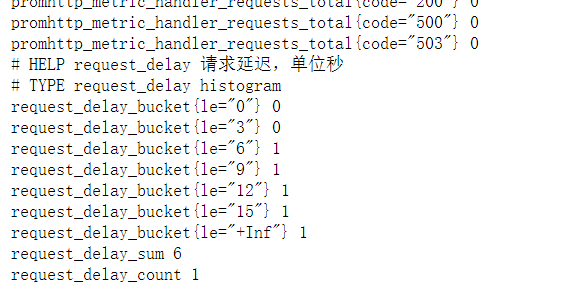
reqDelay := prometheus.NewHistogram(prometheus.HistogramOpts{
Name: "request_delay",
Help: "请求延迟,单位秒",
Buckets: prometheus.LinearBuckets(0, 3, 6), // 调用LinearBuckets生成区间,从0开始,宽度3,共6个Bucket
})
// 注册指标
prometheus.MustRegister(reqDelay)
// 设置值
reqDelay.Observe(6)
// 暴露指标
http.Handle("/metrics", promhttp.Handler())
http.ListenAndServe("localhost:9100", nil)
}
带固定label的例子
package main

import (
    "github.com/prometheus/client_golang/prometheus"
    "github.com/prometheus/client_golang/prometheus/promhttp"
    "net/http"
)

func main() {
    // 定义指标
    reqDelay := prometheus.NewHistogram(prometheus.HistogramOpts{
        Name:        "request_delay",
        Help:        "请求延迟,单位秒",
        Buckets:     prometheus.LinearBuckets(0, 3, 6), // 调用LinearBuckets生成区间,从0开始,宽度3,共6个Bucket
        ConstLabels: prometheus.Labels{"path": "/api"},
    })

    // 注册指标
    prometheus.MustRegister(reqDelay)

    // 设置值
    reqDelay.Observe(6)
    // 暴露指标
    http.Handle("/metrics", promhttp.Handler())
    http.ListenAndServe("localhost:9100", nil)
}
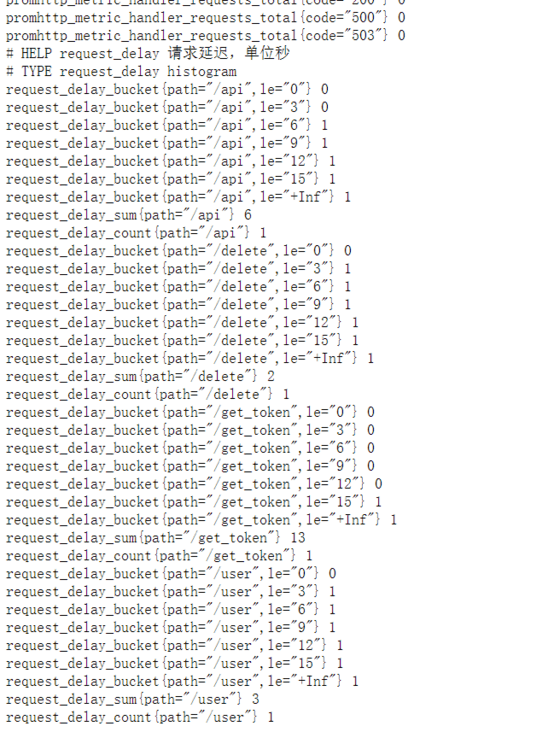
带有非固定label的例子
package main

import (
    "github.com/prometheus/client_golang/prometheus"
    "github.com/prometheus/client_golang/prometheus/promhttp"
    "net/http"
)

func main() {
    // 定义指标
    reqDelay := prometheus.NewHistogramVec(prometheus.HistogramOpts{
        Name:    "request_delay",
        Help:    "请求延迟,单位秒",
        Buckets: prometheus.LinearBuckets(0, 3, 6), // 调用LinearBuckets生成区间,从0开始,宽度3,共6个Bucket
    }, []string{"path"})

    // 注册指标
    prometheus.MustRegister(reqDelay)

    // 设置值
    reqDelay.WithLabelValues("/api").Observe(6)
    reqDelay.WithLabelValues("/user").Observe(3)
    reqDelay.WithLabelValues("/delete").Observe(2)
    reqDelay.WithLabelValues("/get_token").Observe(13)
    // 暴露指标
    http.Handle("/metrics", promhttp.Handler())
    http.ListenAndServe("localhost:9100", nil)
}
4.Summary指标类型
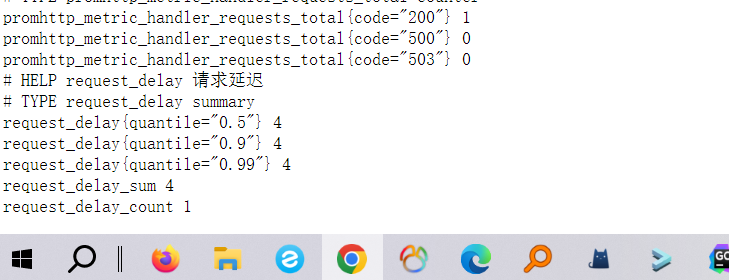
不带label的例子
package main

import (
    "github.com/prometheus/client_golang/prometheus"
    "github.com/prometheus/client_golang/prometheus/promhttp"
    "net/http"
)

func main() {
    // 定义指标
    reqDelay := prometheus.NewSummary(prometheus.SummaryOpts{
        Name:       "request_delay",
        Help:       "请求延迟",
        Objectives: map[float64]float64{0.5: 0.05, 0.90: 0.01, 0.99: 0.001}, // 百分比:精度
    })

    // 注册指标
    prometheus.MustRegister(reqDelay)

    // 设置值
    reqDelay.Observe(4)
    // 暴露指标
    http.Handle("/metrics", promhttp.Handler())
    http.ListenAndServe("localhost:9100", nil)
}
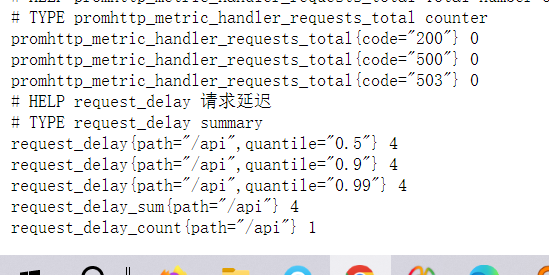
带有固定label的例子
package main

import (
    "github.com/prometheus/client_golang/prometheus"
    "github.com/prometheus/client_golang/prometheus/promhttp"
    "net/http"
)

func main() {
    // 定义指标
    reqDelay := prometheus.NewSummary(prometheus.SummaryOpts{
        Name:        "request_delay",
        Help:        "请求延迟",
        Objectives:  map[float64]float64{0.5: 0.05, 0.90: 0.01, 0.99: 0.001}, // 百分比:精度
        ConstLabels: prometheus.Labels{"path": "/api"},
    })

    // 注册指标
    prometheus.MustRegister(reqDelay)

    // 设置值
    reqDelay.Observe(4)
    // 暴露指标
    http.Handle("/metrics", promhttp.Handler())
    http.ListenAndServe("localhost:9100", nil)
}
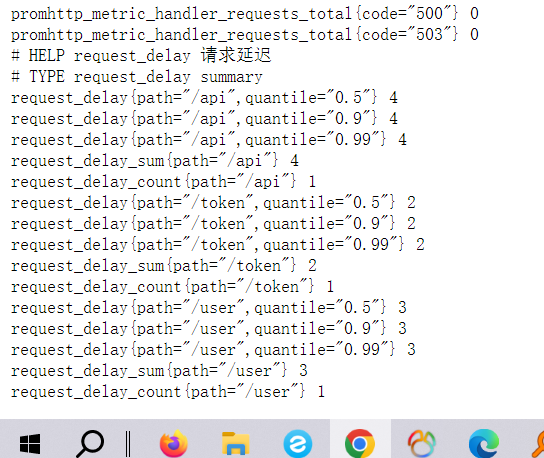
带有非固定label的例子
package main

import (
    "github.com/prometheus/client_golang/prometheus"
    "github.com/prometheus/client_golang/prometheus/promhttp"
    "net/http"
)

func main() {
    // 定义指标
    reqDelay := prometheus.NewSummaryVec(prometheus.SummaryOpts{
        Name:       "request_delay",
        Help:       "请求延迟",
        Objectives: map[float64]float64{0.5: 0.05, 0.90: 0.01, 0.99: 0.001}, // 百分比:精度
    }, []string{"path"})

    // 注册指标
    prometheus.MustRegister(reqDelay)

    // 设置值
    reqDelay.WithLabelValues("/api").Observe(4)
    reqDelay.WithLabelValues("/token").Observe(2)
    reqDelay.WithLabelValues("/user").Observe(3)
    // 暴露指标
    http.Handle("/metrics", promhttp.Handler())
    http.ListenAndServe("localhost:9100", nil)
}
5. 值的修改
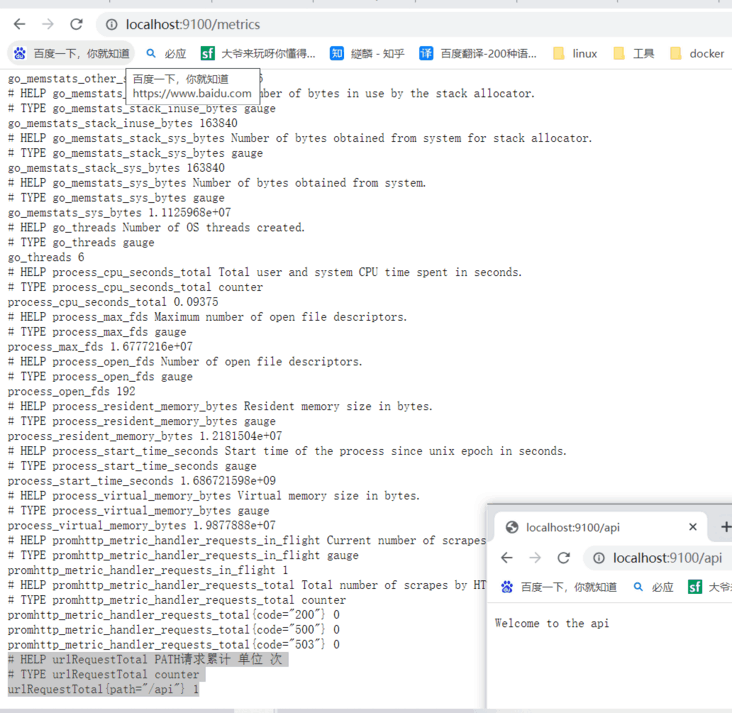
5.1 基于事件的触发来修改值,比如每访问1次/api就增1
基于事件的触发对指标的值进行修改,通常大多数是来自业务方面的指标需求,如自研的应用需要暴露相关指标给promethus进行监控、展示,那么指标采集的代码(指标定义、设置值)就要嵌入到自研应用代码里了。
package main

import (
    "fmt"
    "github.com/prometheus/client_golang/prometheus"
    "github.com/prometheus/client_golang/prometheus/promhttp"
    "net/http"
)

func main() {
    urlRequestTotal := prometheus.NewCounterVec(prometheus.CounterOpts{
        Name: "urlRequestTotal",
        Help: "PATH请求累计 单位 次",
    }, []string{"path"})

    http.HandleFunc("/api", func(w http.ResponseWriter, r *http.Request) {
        urlRequestTotal.WithLabelValues(r.URL.Path).Inc() // 使用Inc函数进行增1
        fmt.Fprintf(w, "Welcome to the api")
    })

    prometheus.MustRegister(urlRequestTotal)
    http.Handle("/metrics", promhttp.Handler())
    http.ListenAndServe("localhost:9100", nil)
}
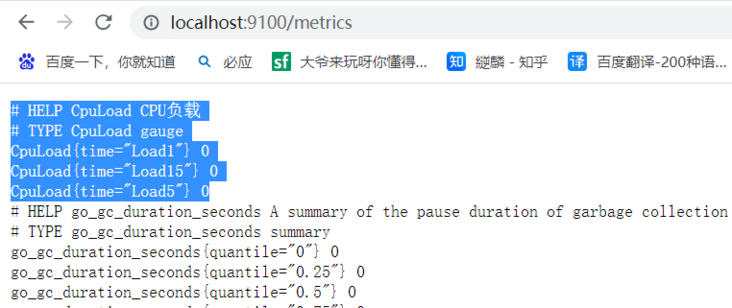
基于时间周期的触发来修改值,比如下面的示例中,是每间隔1秒获取cpu负载指标
基于时间周期的触发,可以是多少秒、分、时、日、月、周。
package main

import (
    "github.com/prometheus/client_golang/prometheus"
    "github.com/prometheus/client_golang/prometheus/promhttp"
    "github.com/shirou/gopsutil/load"
    "net/http"
    "time"
)

func main() {
    cpuUsage := prometheus.NewGaugeVec(prometheus.GaugeOpts{
        Name: "CpuLoad",
        Help: "CPU负载",
    }, []string{"time"})

    // 开启一个子协程执行该匿名函数内的逻辑来给指标设置值,且每秒获取一次
    go func() {
        for range time.Tick(time.Second) {
            info, _ := load.Avg()
            cpuUsage.WithLabelValues("Load1").Set(float64(info.Load1))
            cpuUsage.WithLabelValues("Load5").Set(float64(info.Load5))
            cpuUsage.WithLabelValues("Load15").Set(float64(info.Load15))
        }
    }()

    prometheus.MustRegister(cpuUsage)
    http.Handle("/metrics", promhttp.Handler())
    http.ListenAndServe("localhost:9100", nil)
}
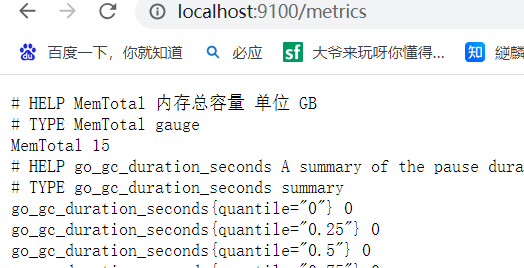
基于每访问一次获取指标的URI才修改值,比如每次访问/metrics才去修改某些指标的值
下面的这个示例是,每访问一次/metrics就获取一次内存总容量
package main

import (
    "fmt"
    "github.com/prometheus/client_golang/prometheus"
    "github.com/prometheus/client_golang/prometheus/promhttp"

    "github.com/shirou/gopsutil/mem"
    "net/http"
)

func main() {
    MemTotal := prometheus.NewGaugeFunc(prometheus.GaugeOpts{
        Name: "MemTotal",
        Help: "内存总容量 单位 GB",
    }, func() float64 {
        fmt.Println("call MemTotal ...")
        info, _ := mem.VirtualMemory()
        return float64(info.Total / 1024 / 1024 / 1024)
    })
    prometheus.MustRegister(MemTotal)
    http.Handle("/metrics", promhttp.Handler())
    http.ListenAndServe("localhost:9100", nil)
}
到此这篇关于Golang自定义开发Prometheus exporter详解的文章就介绍到这了,更多相关Golang Prometheus exporter内容请搜索脚本之家以前的文章或继续浏览下面的相关文章希望大家以后多多支持脚本之家!