
vue3+Echarts实现立体柱状图的示例代码
作者:天使的同类
本文介绍了使用Echarts实现立体柱状图的方法,文中通过示例代码介绍的非常详细,对大家的学习或者工作具有一定的参考学习价值,需要的朋友们下面随着小编来一起学习学习吧
Echarts柱状图中文网:https://echarts.apache.org/examples/zh/index.html#chart-type-bar
效果展示:
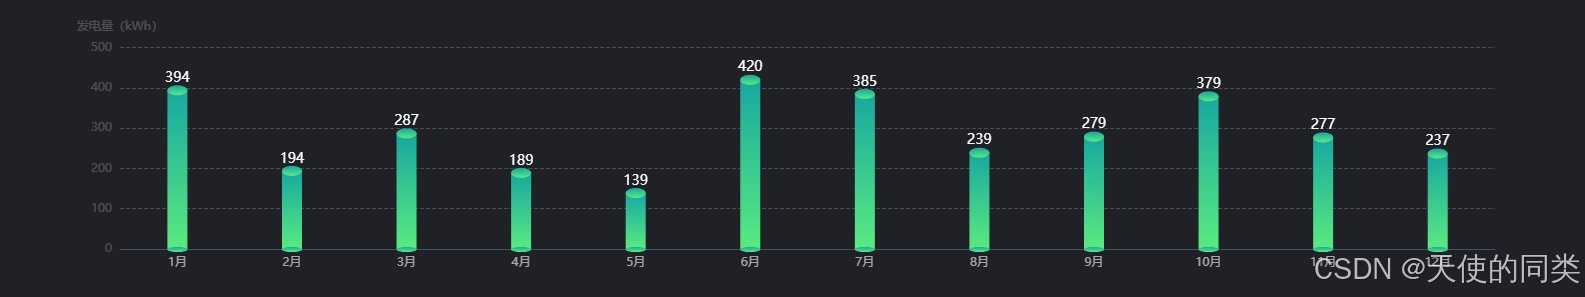
主要实现过程是三部分的组合,最上面是一个椭圆,中间是正常的柱子,下方再加上一个椭圆,就出来立体的效果。
分别展示三段组合代码:
顶部的椭圆形(象形柱图):pictorialBar
      {
        type: "pictorialBar", // pictorialBar(象形柱图)
        symbolSize: [20, 5], // 图形的大小用数组分别比表示宽和高,也乐意设置成10相当于[10,10]
        symbolOffset: [0, 3], // 图形相对于原本位置的偏移
        z: 12, // 象形柱状图组件的所有图形的 z 值.控制图形的前后顺序.z 值小的图形会被 z 值大的图形覆盖.
        itemStyle: {
          color: new echarts.graphic.LinearGradient(0, 0, 0, 1, [
            {
              offset: 0,
              color: "#17A8A0",
            },
            {
              offset: 1,
              color: "#5AEA80",
            },
          ]),
        },
        data: columnData.value,
      },
中间的柱子:bar
      {
        name: "发电量",
        type: "bar",
        barWidth: 20,
        itemStyle: {
          color: {
            x: 0,
            y: 0,
            x2: 0,
            y2: 1,
            type: "linear",
            global: false,
            colorStops: [
              {
                offset: 0,
                color: "#17A8A0",
              },
              {
                offset: 1,
                color: "#5AEA80",
              },
            ],
          },
        },
        data: columnData.value,
        label: {
          show: true,
          position: "top",
          color: "#FFFFFF",
          fontSize: 14,
        },
      },
底部的椭圆形(象形柱图):pictorialBar
     {
        type: "pictorialBar",
        symbolSize: [20, 10],
        symbolOffset: [0, -5],
        z: 12,
        symbolPosition: "end",
        itemStyle: {
          color: new echarts.graphic.LinearGradient(0, 0, 0, 1, [
            {
              offset: 0,
              color: "#17A8A0",
            },
            {
              offset: 1,
              color: "#5AEA80",
            },
          ]),
        },
        data: columnData.value,
      },
整体代码如下:
<template>
  <div
    id="stereoscopicChart"
    style="width: 100%; height: 270px"
  ></div>
</template>

<script setup lang="ts">
import { onMounted, ref } from "vue";
import * as echarts from "echarts";
// 横坐标data数据
const xData = ref([
  "1月",
  "2月",
  "3月",
  "4月",
  "5月",
  "6月",
  "7月",
  "8月",
  "9月",
  "10月",
  "11月",
  "12月",
]);
// 柱状data数据
const columnData = ref([
  394, 194, 287, 189, 139, 420, 385, 239, 279, 379, 277, 237,
]);

let myStereoscopicChart: echarts.ECharts | null = null;
const showStereoscopicEcharts = () => {
  if (!myStereoscopicChart) {
    const stereoscopicChartDom = document.getElementById("stereoscopicChart");
    myStereoscopicChart = echarts.init(stereoscopicChartDom);
  }
  const stereoscopicOption = {
    tooltip: {
      trigger: "axis",
      formatter: "{b}
 发电量   {c}kWh",
      type: "line",
      axisPointer: {
        lineStyle: {
          color: "#17A8A0",
        },
      },
      backgroundColor: "rgba(7,18,26, 1)",
      borderWidth: 0,
      textStyle: {
        color: "#fff",
        fontSize: 14,
        align: "left",
      },
    },
    // 图例
    legend: {
      show: false,
    },
    // 图表位置
    grid: {
      left: "5%",
      right: "5%",
      top: "18%",
      bottom: "0%",
      containLabel: true,
    },
    xAxis: [
      {
        type: "category",
        axisLine: {
          lineStyle: {
            color: "#415264",
            width: 1,
            type: "solid",
          },
        },
        axisLabel: {
          color: "rgba(255,255,255,0.6)",
          fontSize: 12,
        },
        axisTick: {
          show: false,
        },
        data: xData.value,
      },
    ],
    yAxis: [
      {
        name: "发电量(kWh)",
        type: "value",
        axisTick: {
          show: false,
        },
        axisLine: {
          lineStyle: {
            color: "rgba(255,255,255,0.2)",
          },
        },
        axisLabel: {
          color: "rgba(255,255,255,0.2)",
          fontSize: 12,
        },
        splitLine: {
          lineStyle: {
            color: "rgba(255,255,255,0.2)",
            type: "dashed",
          },
        },
      },
    ],
    series: [
      // 底部的椭圆形(象形柱图):pictorialBar
      {
        type: "pictorialBar", // pictorialBar(象形柱图)
        symbolSize: [20, 5], // 图形的大小用数组分别比表示宽和高,也乐意设置成10相当于[10,10]
        symbolOffset: [0, 3], // 图形相对于原本位置的偏移
        z: 12, // 象形柱状图组件的所有图形的 z 值.控制图形的前后顺序.z 值小的图形会被 z 值大的图形覆盖.
        itemStyle: {
          color: new echarts.graphic.LinearGradient(0, 0, 0, 1, [
            {
              offset: 0,
              color: "#17A8A0",
            },
            {
              offset: 1,
              color: "#5AEA80",
            },
          ]),
        },
        data: columnData.value,
      },
      {
        name: "发电量",
        type: "bar",
        barWidth: 20,
        itemStyle: {
          color: {
            x: 0,
            y: 0,
            x2: 0,
            y2: 1,
            type: "linear",
            global: false,
            colorStops: [
              {
                offset: 0,
                color: "#17A8A0",
              },
              {
                offset: 1,
                color: "#5AEA80",
              },
            ],
          },
        },
        data: columnData.value,
        label: {
          show: true,
          position: "top",
          color: "#FFFFFF",
          fontSize: 14,
        },
      },
      {
        type: "pictorialBar",
        symbolSize: [20, 10],
        symbolOffset: [0, -5],
        z: 12,
        symbolPosition: "end",
        itemStyle: {
          color: new echarts.graphic.LinearGradient(0, 0, 0, 1, [
            {
              offset: 0,
              color: "#17A8A0",
            },
            {
              offset: 1,
              color: "#5AEA80",
            },
          ]),
        },
        data: columnData.value,
      },
    ],
  };
  stereoscopicOption && myStereoscopicChart.setOption(stereoscopicOption);
};
const resizeChart = () => {
  if (myStereoscopicChart) {
    myStereoscopicChart.resize();
  }
};
onMounted(() => {
  showStereoscopicEcharts();
  window.addEventListener("resize", resizeChart);
});
</script>
到此这篇关于vue3+Echarts实现立体柱状图的示例代码的文章就介绍到这了,更多相关vue3 Echarts 立体柱状图内容请搜索脚本之家以前的文章或继续浏览下面的相关文章希望大家以后多多支持脚本之家!