
前端地图(openlayers)基础使用示例代码
作者:Xiao_zuo_ya
这篇文章主要介绍了前端地图(openlayers)基础使用的相关资料,OpenLayers是开源地图框架,支持加载国内外地图服务(如天地图),提供瓦片、矢量、影像图层,需要的朋友可以参考下
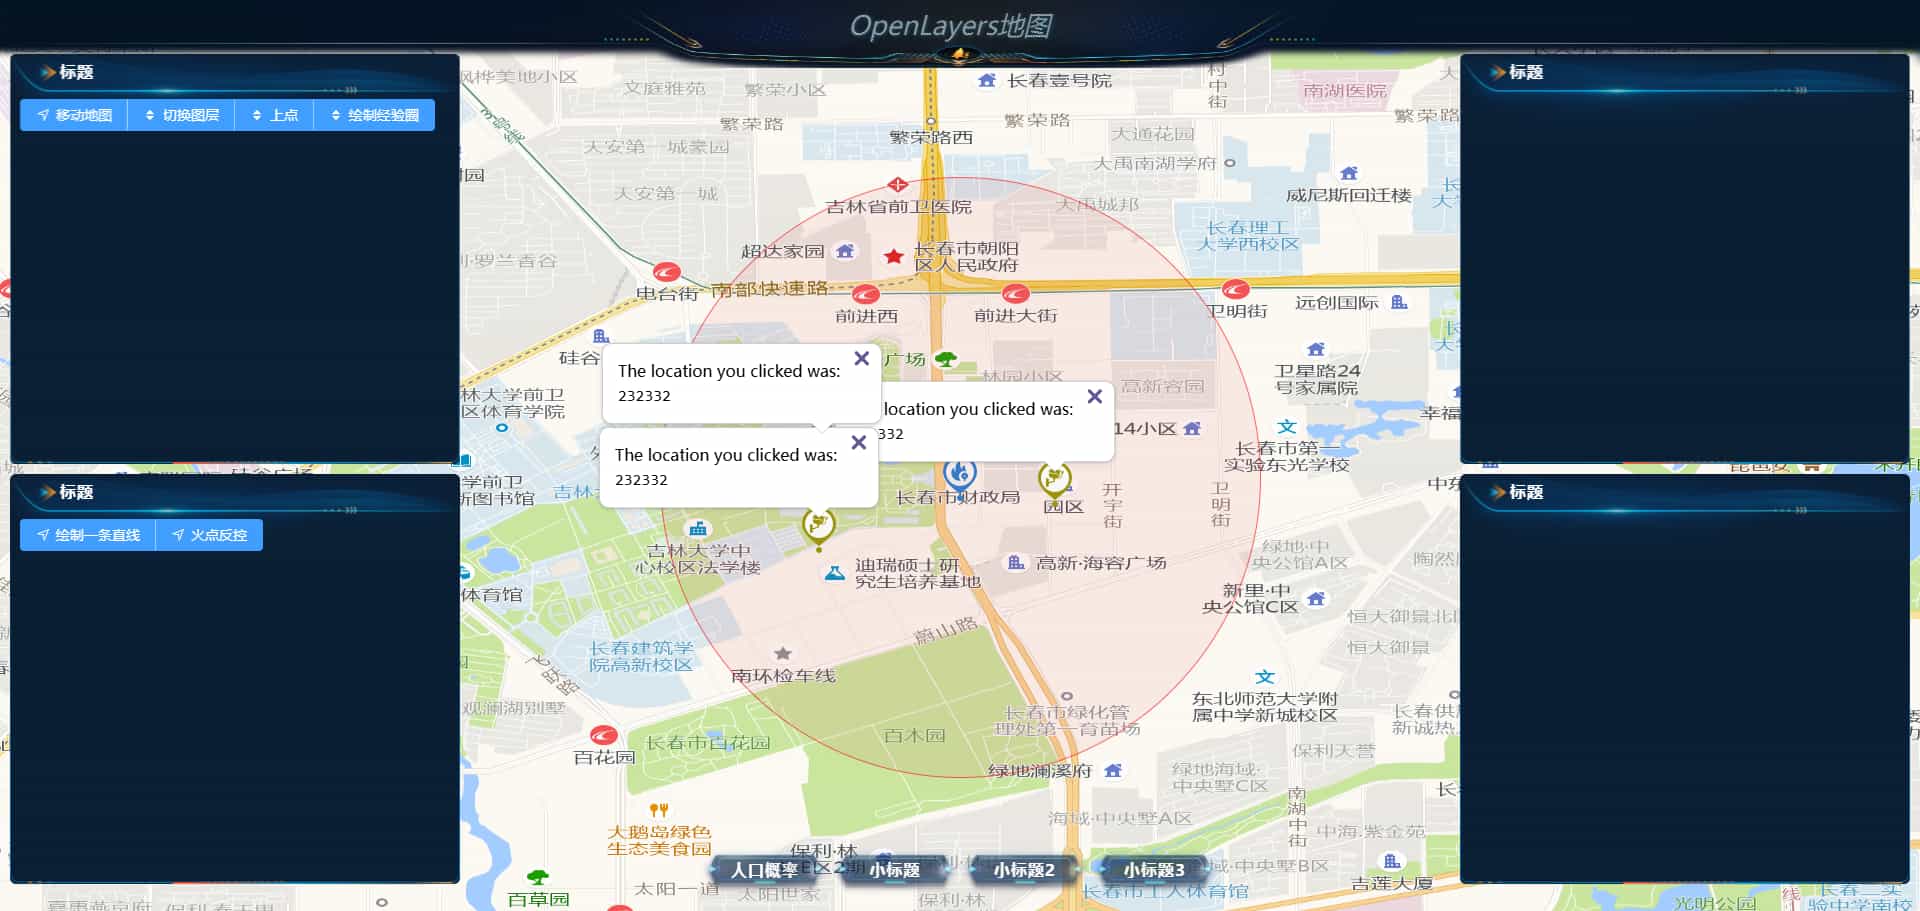
最终效果
Openlayers框架的主要作用是什么?
在浏览器页面中引入一个地图,openlayers 是外国的一个地图框架,本身内置一些国外的地图,但是必须科学 上网才能使用,可以通过加载url的形式访问国内的地图服务,高德,百度,腾讯,天地图等已经发布的图层。
地图主流词汇了解
- 瓦片
- 图层
- 矢量地图
- 影像地图
- 墨卡托投影
安装并且使用Openlayers
项目环境
"vite": "^5.4.1",
"vue": "^3.4.37",
"ol": "^10.4.0",
pnpm install ol
基于天地图初步展示一个地图
<template>
  <div id="mapContainer" class="TianDiMap"></div>
</template>

<script setup lang="ts">
import {onMounted} from "vue";
import "ol/ol.css";
import {Map, View} from "ol";
import TileLayer from "ol/layer/Tile";
import {XYZ} from "ol/source";
// 地图是一层一层的加载
// ol 是以面向对象的形式来设计的api
// map中的配置选项
// target 表示地图示例挂载的容器
// view 表示地图的视图
// layers 表示地图的图层 所有的地图都有一个底图,Source 就是地图的来源
const initMap = () => {
  const map = new Map({
    target: "mapContainer",
    view: new View({
      center: [116.397477, 39.908692],
      zoom: 10,
      projection: "EPSG:4326",
    }),
    layers: [new TileLayer({
      source: new XYZ({
        url: 'http://t0.tianditu.gov.cn/img_w/wmts?SERVICE=WMTS&REQUEST=GetTile&VERSION=1.0.0&LAYER=img&STYLE=default&TILEMATRIXSET=w&FORMAT=tiles&TILEMATRIX={z}&TILEROW={y}&TILECOL={x}&tk={你的秘钥}',
      })
    })]
  })
}

onMounted(() => {
  initMap();
});
</script>

<style scoped lang="less">
.TianDiMap {
  width: 100%;
  height: 100%;
}

</style>
地图增加动画效果
const removeCenterTo = (target: Point) => {
  view.animate({
    center: [target.longitude, target.latitude],
    zoom: 12,
    duration: 2000,
  });
};
图层(layer)
layer & source
瓦片图层tileLayer加载底图
静态图片图层imageLayer加载静态图片
矢量图层vectorLayer加载矢量数据添加地图标注
瓦片数据源
静态图片数据源
矢量数据源
切换底图
- 可以通过切换图层的层级实现
  const layers: Collection<BaseLayer> = map.getLayers();
  layers.item(0).setZIndex(100);
  layers.item(1).setZIndex(99);
  layers.item(2).setZIndex(30);
- 也可以通过添加&移除图层实现
  map.removeLayer(layers.item(0));
  map.addLayer(layers.item(1))
- 通过控制图层的显示和隐藏
layers.item(2).setVisible(false)
加载矢量图层
将一些矢量数据(很多格式,最常见的是GeoJson)加载到地图上
绘制行政区划边界
const geoJsonLayer = new VectorLayer({
  source: new VectorSource({
    // url: "https://geo.datav.aliyun.com/areas_v3/bound/220100_full.json",
    url: "/geoJsonData/ChangChunGeo.json",
    format: new GeoJSON(),
  }),
});
行政区划增加样式
const geoJsonLayer = new VectorLayer({
  // 加载行政区划边界
  source: new VectorSource({
    // url: "https://geo.datav.aliyun.com/areas_v3/bound/220100_full.json",
    url: "/geoJsonData/ChangChunGeo.json",
    format: new GeoJSON(),
  }),
  // 覆盖物样式
  style: new Style({
    fill: new Fill({
      color: "rgba(216,91,91,0.2)",
    }),
    stroke: new Stroke({
      width: 1,
      color: "rgba(216,91,91,1)",
    }),
  }),
});
鼠标移入高亮省份
const addGeoJsonLayer = () => {
  const geoJsonLayer: VectorLayer = new VectorLayer({
    // 加载行政区划边界
    source: new VectorSource({
      // url: "https://geo.datav.aliyun.com/areas_v3/bound/220100_full.json",
      url: "/geoJsonData/ChangChunGeo.json",
      format: new GeoJSON(),
    }),
    // 覆盖物样式
    style: new Style({
      fill: new Fill({
        color: "rgba(216,91,91,0.2)",
      }),
      stroke: new Stroke({
        width: 1,
        color: "rgba(216,91,91,1)",
      }),
    }),
  });
  // 添加行政区划边界
  map.addLayer(geoJsonLayer);

  map.on("pointermove", (event) => {
    // 获取当前鼠标移动到的坐标
    const coordinate = event.coordinate;
    // 当前鼠标位置是否具有要素信息--是否存在features
    (geoJsonLayer as any)
      .getSource()
      .getFeatures()
      .forEach((feature: Feature) => {
        feature.setStyle(
          new Style({
            fill: new Fill({
              color: "rgba(216,91,91,0.2)",
            }),
            stroke: new Stroke({
              width: 1,
              color: "rgba(216,91,91,1)",
            }),
          })
        );
      });
    map.getTargetElement().style.cursor = "";
    const features = (geoJsonLayer as any)
      .getSource()
      .getFeaturesAtCoordinate(coordinate);
    if (features[0]) {
      map.getTargetElement().style.cursor = "pointer";
      features[0].setStyle(
        new Style({
          fill: new Fill({
            color: "rgb(166,216,91,0.2)",
          }),
        })
      );
    }
  });
};
地图上点功能
const addPoints = (pointList: Array<Point>) => {
  const iconFeatureList = pointList.map((point) => {
    const feature = new Feature({
      geometry: point,
    });
    feature.setStyle(
      new Style({
        image: new Icon({
          src: "./camera_icon.png", // 补全图片路径
        }),
      })
    );
    return feature;
  });
  const iconSource = new VectorSource({
    features: iconFeatureList,
  });
  const iconLayer = new VectorLayer({
    source: iconSource,
  });
  map.addLayer(iconLayer);
};
绘制直线
const drawLine = (startPoint: Point, endPoint: Point) => {
  const lineFeature = new Feature({
    geometry: new LineString([
      startPoint.getCoordinates(),
      endPoint.getCoordinates(),
    ]),
  });
  lineFeature.setStyle(
    new Style({
      stroke: new Stroke({
        color: "red",
        width: 2,
      }),
    })
  );

  const lineSource = new VectorSource({
    features: [lineFeature],
  });

  const lineLayer = new VectorLayer({
    source: lineSource,
  });
  map.addLayer(lineLayer);
};
overLay
const pointList = [
      new Point([125.285029, 43.825662]),
      new Point([125.2849, 43.822039]),
      new Point([125.295028, 43.824021]),
    ];

    const htmlDocument =
      '<div id="popup" class="ol-popup">' +
      '<a href="#" rel="external nofollow"  id="popup-closer" class="ol-popup-closer"></a>' +
      '<div id="popup-content"><p>The location you clicked was:</p><code>232332</code></div>' +
      "</div>";

    pointList.forEach((item: Point) => {
      const element = document.createElement("div");
      element.innerHTML = htmlDocument;
      const detailOverLay = new Overlay({
        element: element,
        position: item.getCoordinates(),
        offset: [0, -10],
      });
      map.addOverlay(detailOverLay);
    });
.ol-popup {
  position: absolute;
  background-color: white;
  box-shadow: 0 1px 4px rgba(0, 0, 0, 0.2);
  padding: 15px;
  border-radius: 10px;
  border: 1px solid #cccccc;
  bottom: 12px;
  left: -220px;
  min-width: 280px;
}
.ol-popup:after,
.ol-popup:before {
  top: 100%;
  border: solid transparent;
  content: " ";
  height: 0;
  width: 0;
  position: absolute;
  pointer-events: none;
}
.ol-popup:after {
  border-top-color: white;
  border-width: 10px;
  left: 219px;
  margin-left: -10px;
}
.ol-popup:before {
  border-top-color: #cccccc;
  border-width: 11px;
  left: 219px;
  margin-left: -11px;
}
.ol-popup-closer {
  text-decoration: none;
  position: absolute;
  top: 2px;
  right: 8px;
}
.ol-popup-closer:after {
  content: "✖";
}
总结
到此这篇关于前端地图(openlayers)基础使用的文章就介绍到这了,更多相关前端地图openlayers基础内容请搜索脚本之家以前的文章或继续浏览下面的相关文章希望大家以后多多支持脚本之家!