
ECharts饼图颜色设置的4种方式总结
作者:蓝胖子的多啦A梦
这篇文章主要给大家介绍了关于ECharts饼图颜色设置的4种方式,ECharts饼图的颜色可以通过多种方式进行设置,文中通过代码介绍的非常详细,需要的朋友可以参考下
ECharts 饼状图颜色设置教程
- 方法一:在
series内配置饼状图颜色 - 方法二:在
option内配置饼状图颜色 - 方法三:在
data内配置饼状图颜色 - 方法四:配置 ECharts 饼状图随机颜色
Charts 饼状图中的每个扇形颜色其实都可以自定义或者随机显示颜色。本文讲解 4 种配置修改 ECharts 饼图颜色的方法。
方法一:在 series 内配置饼状图颜色
series: [
  itemStyle: {
    normal: {
      color: function (colors) {
         var colorList = [
                    '#fc8251',
                    '#5470c6',
                    '#9A60B4',
                    '#ef6567',
                    '#f9c956',
                    '#3BA272'
                  ];
         return colorList[colors.dataIndex];
       }
     },
   }
 ]
EChart.js 在 series 中设置饼状图颜色的 Demo 源代码:
 this.chart.setOption({
        legend: {
          orient: "vertical",
          left: "left",
          textStyle: {
            //图例中文字的样式
            color: "#ffffff",
            fontSize: 12,
          },
        },
        series: [
          {
            type: "pie",
            radius: "50%",
            data: this.optionData,
            emphasis: {
              itemStyle: {
                shadowBlur: 10,
                shadowOffsetX: 0,
                shadowColor: "rgba(0, 0, 0, 0.5)",
              },
            },
            labelLine: {
              show: false, //隐藏指示线
            },
            label: {
              show: false, //隐藏标示文字
            },
            itemStyle: {
              normal: {
                color: function (colors) {
                  var colorList = [
                    '#fc8251',
                    '#5470c6',
                    '#9A60B4',
                    '#ef6567',
                    '#f9c956',
                    '#3BA272'
                  ];
                  return colorList[colors.dataIndex];
                }
              },
            }
          },
        ],
      });
效果

方法二:在 option 内配置饼状图颜色
this.chart.setOption({
legend: {
orient: "vertical",
left: "left",
textStyle: {
//图例中文字的样式
color: "#ffffff",
fontSize: 12,
},
},
color:['#fc8251','#5470c6','#9A60B4','#ef6567', '#f9c956','#3BA272'];
series: [
{
type: "pie",
radius: "50%",
data: this.optionData,
emphasis: {
itemStyle: {
shadowBlur: 10,
shadowOffsetX: 0,
shadowColor: "rgba(0, 0, 0, 0.5)",
},
},
labelLine: {
show: false, //隐藏指示线
},
label: {
show: false, //隐藏标示文字
},
},
],
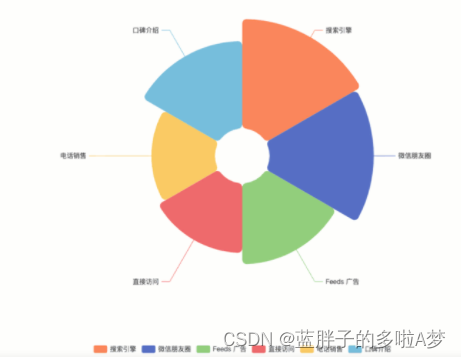
});方法三:在 data 内配置饼状图颜色
**data: [
        { value: 917, name: '搜索引擎',itemStyle: {color:'#fc8251'}},
        { value: 873, name: '微信朋友圈',itemStyle: {color:'#5470c6'}},
        { value: 678, name: 'Feeds 广告',itemStyle: {color:'#91cd77'}},
        { value: 583, name: '直接访问',itemStyle: {color:'#ef6567'}},
        { value: 432, name: '口碑介绍',itemStyle: {color:'#f9c956'}}
      ]
**
EChart.js 在 data 中设置饼状图颜色的 Demo 源代码:
option = {
  legend: {
    top: 'bottom'
  },
  series: [
    {
      name: '',
      type: 'pie',
      radius: [50, 250],
      center: ['50%', '50%'],
      roseType: 'area',
      itemStyle: {
        borderRadius: 8
      },
      data: [
        { value: 917, name: '搜索引擎',itemStyle: {color:'#fc8251'}},
        { value: 873, name: '微信朋友圈',itemStyle: {color:'#5470c6'}},
        { value: 678, name: 'Feeds 广告',itemStyle: {color:'#91cd77'}},
        { value: 583, name: '直接访问',itemStyle: {color:'#ef6567'}},
        { value: 332, name: '电话销售',itemStyle: {color:'#f9c956'} },
        { value: 432, name: '口碑介绍',itemStyle: {color:'#75bedc'}}
      ]
    }
  ]
};
方法四:配置 ECharts 饼状图随机颜色
color: function () {
          return (
            'rgb(' +
            [
              Math.round(Math.random() * 270),
              Math.round(Math.random() * 370),
              Math.round(Math.random() * 400)
            ].join(',') +
            ')'
          );
        },
option = {
  legend: {
    top: 'bottom'
  },
  series: [
    {
      name: '',
      type: 'pie',
      radius: [50, 250],
      center: ['50%', '50%'],
      roseType: 'area',
      itemStyle: {
        color: function () {
          return (
            'rgb(' +
            [
              Math.round(Math.random() * 270),
              Math.round(Math.random() * 370),
              Math.round(Math.random() * 400)
            ].join(',') +
            ')'
          );
        },
        borderRadius: 8
      },
      data: [
        { value: 917, name: '搜索引擎'},
        { value: 873, name: '微信朋友圈'},
        { value: 678, name: 'Feeds 广告'},
        { value: 583, name: '直接访问'},
        { value: 332, name: '电话销售'},
        { value: 432, name: '口碑介绍'}
      ]
    }
  ]
};
总结
到此这篇关于ECharts饼图颜色设置的4种方式总结的文章就介绍到这了,更多相关ECharts饼图颜色设置内容请搜索脚本之家以前的文章或继续浏览下面的相关文章希望大家以后多多支持脚本之家!