Python实现数据可视化大屏布局的示例详解
作者:Sir 老王
数据可视化大屏展示需求无疑是对数据分析结果最好的诠释,能够使得别人能够轻松的就理解我们的数据意图。
之前我们可视化的展示过程中已经使用几种比较优秀的python数据可视化应用模块,有兴趣的朋友可以前往历史文章中搜索相应的实战案例。
今天所说的数据可视化的大屏展示是通过pyecharts模块来实现的,由于其本身生成的就是html的代码块,这一点非常有利于我们对大屏实现的要求。
若是没有安装pyecharts非标准库的朋友可以使用pip的方式安装一下即可。
pip install pyecharts -i https://pypi.tuna.tsinghua.edu.cn/simple/
完事儿之后,我们将所有需要使用到的python模块全部导入到我们的代码块中。
# Importing the options module from the pyecharts package and renaming it to opts.
from pyecharts import options as opts

# Importing the Bar and Scatter3D classes from the pyecharts.charts module.
from pyecharts.charts import Bar, Scatter3D

# Importing the random module.
import random
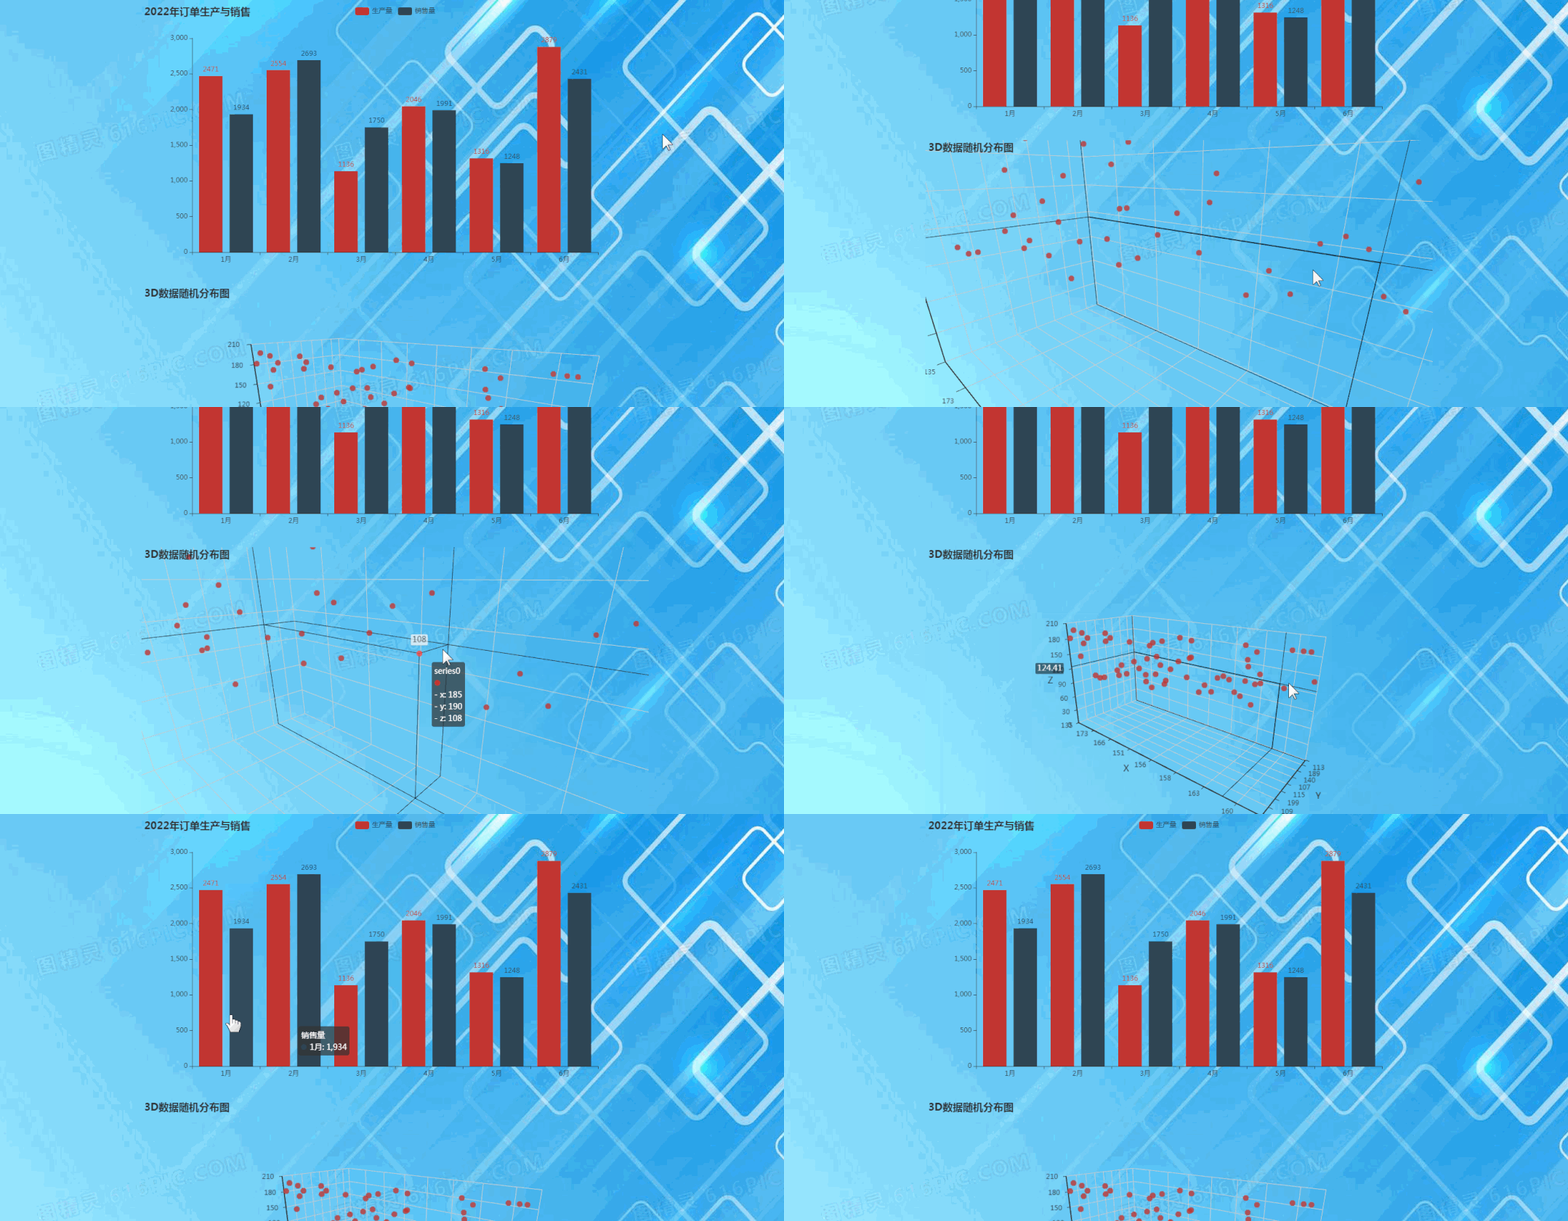
为了展示大屏的布局效果,我们分别实现了柱状图、3D数据图的展示效果从而在大屏中进行展示。
若是想要加入线形图、饼图等其他类型的可视化图形,我们可以直接在大屏布局中进行自由添加。
开发一个函数bar(),用来画出柱状图的显示效果,并返回柱状图对象。
def bar():
    """
    It does nothing.
    """
    cate = ['1月', '2月', '3月', '4月', '5月', '6月']
    bar_ = (
        Bar()
            .add_xaxis(cate)
            .add_yaxis("生产量", [random.randint(1000, 3000) for _ in cate])
            .add_yaxis("销售量", [random.randint(1200, 2800) for _ in cate])
            .set_global_opts(title_opts=opts.TitleOpts(title="2022年订单生产与销售"))
    )
    return bar_
开发一个函数scatter_3d(),用来画出3D的显示效果,并返回3D图对象。
def scatter_3d():
    """
    > This function takes in a list of x, y, and z coordinates and plots them in a 3D scatter plot
    """
    data = [(random.randint(100, 200), random.randint(100, 200), random.randint(100, 200)) for _ in range(60)]
    scatter_ = (Scatter3D()
        .add("", data)
        .set_global_opts(
        title_opts=opts.TitleOpts(title="3D数据随机分布图"))
    )
    return scatter_
开发完两个图形绘制的函数之后,我们需要将其展示到页面中,这里采用pyechaerts模块页面组件Page对象。
# Importing the Page class from the pyecharts.charts module.
from pyecharts.charts import Page

# Creating a page object with a simple page layout.
page = Page(layout=Page.SimplePageLayout)
page.add(
    bar(),
    scatter_3d(),
)
page.render("数据中心.html")
通过上面的操作已经完成了页面的图形绘制,并且生成了html的源代码,只需要将.html的文件拖到浏览器中即可查看大屏的可视化效果。

接下来为了使可视化的数据展示的更加的美观,我们可以使用bs4模块的BeautifulSoup对象初始化html对象后修改背景展示效果。
# Importing the BeautifulSoup class from the bs4 module.
from bs4 import BeautifulSoup


with open("数据中心.html", "r+", encoding='utf-8') as h:
    html_ = BeautifulSoup(h, 'lxml')
    body = html_.find("body")
    body["style"] = "background-image: url(背景.jpeg);background-repeat: no-repeat;background-size:cover;"
    html_new = str(html_)
    h.seek(0, 0)
    h.truncate()
    h.write(html_new)
找一张自己能看顺眼的高清背景图,将下面这行代码块中的背景图替换成自己的背景图片路径即可。
background-image: url(背景.jpeg)

到此这篇关于Python实现数据可视化大屏布局的示例详解的文章就介绍到这了,更多相关Python数据可视化大屏内容请搜索脚本之家以前的文章或继续浏览下面的相关文章希望大家以后多多支持脚本之家!
