
python转换wrf输出的数据为网页可视化json格式
作者:oceanography-Rookie
前言
- 一般网页可视化风场中的数据都是json格式,而如果我们希望将wrf模式模拟输出的风场数据在网页中进行展示,这就需要先将wrfoutput数据转换为网页可以识别的json格式。
- 这里主要需要用到json库,主要的实现方式就是将读取的风场风量U,V转换为字典并存到json文件中
- 同时,由于wrf模拟的数据一般是非等间距的网格,需要先将数据进行插值,插值到等间距的网格,这里可以通过NCL的函数
rcm2rgrid_Wrap实现
举个例子,将模式中设置为兰伯特投影的网格:

插值为等间距网格:

主要的编程分为两部分:
- 第一部分通过NCL脚本将wrfout数据转换为等间距网格,并导出为netcdf格式;
- 第二部分通过python脚本将第一步导出的nc格式进行转换,并保存输出为json格式。
NCL插值脚本1
需要修改的就是路径和变量,我下面展示脚本不仅有风场数据u,v还有降水,海表面压力,气温等,可自行修改
begin
  a = addfile("/Users/WRF/outdata/2022071000/wrfout_d01_2022-07-10_01:00:00","r")
  lat2d = a->XLAT(0,:,:)
  lon2d = a->XLONG(0,:,:)
  lat1d = lat2d(:,0)
  lon1d = lon2d(0,:)

  time = wrf_user_getvar(a,"XTIME",-1)
  u10 = wrf_user_getvar(a,"U10",0)
  v10 = wrf_user_getvar(a,"V10",0)
  slp = wrf_user_getvar(a,"slp",0)
  t2  = wrf_user_getvar(a,"T2",0)
  td  = wrf_user_getvar(a,"td",0)
  rainc = wrf_user_getvar(a,"RAINC",0)
  rainnc = wrf_user_getvar(a,"RAINNC",0)

  u10@lat2d = lat2d
  u10@lon2d = lon2d
  u10_ip = rcm2rgrid_Wrap(lat2d,lon2d,u10,lat1d,lon1d,0)

  v10@lat2d = lat2d
  v10@lon2d = lon2d
  v10_ip = rcm2rgrid_Wrap(lat2d,lon2d,v10,lat1d,lon1d,0)

  slp_ip  =   rcm2rgrid_Wrap(lat2d,lon2d,slp,lat1d,lon1d,0)
  t2_ip  =   rcm2rgrid_Wrap(lat2d,lon2d,t2,lat1d,lon1d,0)
  td_ip  =   rcm2rgrid_Wrap(lat2d,lon2d,td,lat1d,lon1d,0)
  rainc_ip  =   rcm2rgrid_Wrap(lat2d,lon2d,rainc,lat1d,lon1d,0)
  rainnc_ip  =   rcm2rgrid_Wrap(lat2d,lon2d,rainnc,lat1d,lon1d,0)
  outf = addfile("/Users/wrfout_d01_2022-07-10_01:00:00.nc","c")
  outf->time =  time
  outf->lat  =  lat2d
  outf->lon  =  lon2d
  outf->u10  =  u10_ip
  outf->v10  =  v10_ip
  outf->slp  =  slp_ip
  outf->t2   =  t2_ip
  outf->td   =  td_ip
  outf->rainc   =  rainc_ip
  outf->rainnc  =  rainnc_ip
end
上述脚本的缺点在于只能基于模式模拟的经纬度区域进行插值,意思就是说他的经纬度区域是固定的那么大
NCL插值脚本2
NCL还有一个函数可以实现上述过程,就是ESMF_regrid,该函数的优点在于可以实现任意经纬度范围的插值,但是不足在于对于存在高度层的变量,暂时无法进行高度层的数据读取。
(也可能我水平有限不知道。。。。)这里也附上脚本:
load "$NCARG_ROOT/lib/ncarg/nclscripts/esmf/ESMF_regridding.ncl"

begin
  a = addfile("/Users/WRF/outdata/2022071000/wrfout_d01_2022-07-10_01:00:00","r")
  u10 = wrf_user_getvar(a,"U10",0)
  v10 = wrf_user_getvar(a,"V10",0)
  slp = wrf_user_getvar(a,"slp",0)
  t2  = wrf_user_getvar(a,"T2",0)
;  td  = wrf_user_getvar(a,"td",0)
  rainc = wrf_user_getvar(a,"RAINC",0)
  rainnc = wrf_user_getvar(a,"RAINNC",0)

  u10@lat2d = a->XLAT(0,:,:)
  u10@lon2d = a->XLONG(0,:,:)
  v10@lat2d = a->XLAT(0,:,:)
  v10@lon2d = a->XLONG(0,:,:)
  slp@lat2d = a->XLAT(0,:,:)
  slp@lon2d = a->XLONG(0,:,:)
  t2@lat2d = a->XLAT(0,:,:)
  t2@lon2d = a->XLONG(0,:,:)
;  td@lat2d = a->XLAT(0,:,:)
;  td@lon2d = a->XLONG(0,:,:)
  rainc@lat2d = a->XLAT(0,:,:)
  rainc@lon2d = a->XLONG(0,:,:)
  rainnc@lat2d = a->XLAT(0,:,:)
  rainnc@lon2d = a->XLONG(0,:,:)

  lat2d = a->XLAT(0,:,:)
  lon2d = a->XLONG(0,:,:)
  lat1d = lat2d(:,0)
  lon1d = lon2d(0,:)
  latS = -20
  latN = 50
  lonW = 95
  lonE = 145

  Opt = True
  Opt@InterpMethod = "bilinear"
  Opt@ForceOverwrite = True

  Opt@SrcMask2D = where(.not. ismissing(v10),1,0)
  Opt@DstGridType = "0.1deg"
  Opt@DstLLCorner = (/latS, lonW /)
  Opt@DstURCorner = (/latN, lonE /)

  u10_regrid = ESMF_regrid(u10,Opt)
  v10_regrid = ESMF_regrid(v10,Opt)
  slp_regrid = ESMF_regrid(slp,Opt)
  t2_regrid = ESMF_regrid(t2,Opt)
;  td_regrid = ESMF_regrid(td,Opt)
  rainc_regrid = ESMF_regrid(rainc,Opt)
  rainnc_regrid = ESMF_regrid(rainnc,Opt)

  time = wrf_user_getvar(a,"XTIME",-1)

  nlon = dimsizes(v10_regrid&lon)
  nlat = dimsizes(v10_regrid&lat)

  ofile = "wrfout_d01_2022-07-10_01:00:00.nc"
  system("rm -rf "+ofile)
  fout = addfile(ofile,"c")

  dimNames = (/"lat", "lon"/)
  dimSizes = (/nlat, nlon/)
  dimUnlim = (/False, False/)

  filedimdef(fout,dimNames,dimSizes,dimUnlim) ;-- define dimensions

  filevardef(fout,"lat",typeof(v10_regrid&lat),getvardims(v10_regrid&lat))
  filevardef(fout,"lon",typeof(v10_regrid&lon),getvardims(v10_regrid&lon))

  filevardef(fout,"u10",typeof(u10_regrid),getvardims(u10_regrid))
  filevardef(fout,"v10",typeof(v10_regrid),getvardims(v10_regrid))
  filevardef(fout,"slp",typeof(slp_regrid),getvardims(slp_regrid))
  filevardef(fout,"t2",typeof(t2_regrid),getvardims(t2_regrid))
;  filevardef(fout,"td",typeof(td_regrid),getvardims(td_regrid))
  filevardef(fout,"rainc",typeof(rainc_regrid),getvardims(rainc_regrid))
  filevardef(fout,"rainnc",typeof(rainnc_regrid),getvardims(rainnc_regrid))

  filevarattdef(fout,"lat",v10_regrid&lat) ;-- copy lat attributes
  filevarattdef(fout,"lon",v10_regrid&lon) ;-- copy lon attributes
  filevarattdef(fout,"u10",u10_regrid)
  filevarattdef(fout,"v10",v10_regrid)
  filevarattdef(fout,"slp",slp_regrid)
  filevarattdef(fout,"t2",t2_regrid)
;  filevarattdef(fout,"td",td_regrid)
  filevarattdef(fout,"rainc",rainc_regrid)
  filevarattdef(fout,"rainnc",rainnc_regrid)

  setfileoption(fout,"DefineMode",False)

  fout->u10 = (/u10_regrid/)
  fout->v10 = (/v10_regrid/)
  fout->slp = (/slp_regrid/)
  fout->t2 = (/t2_regrid/)
;  fout->td = (/td_regrid/)
  fout->rainc  = (/rainc_regrid/)
  fout->rainnc = (/rainnc_regrid/)

  fout->lat = (/v10_regrid&lat/) ;-- write lat to new netCDF file
  fout->lon = (/v10_regrid&lon/) ;-- write lon to new netCDF file
  fout->time =  time
endPS:运行该脚本会生成四个nc文件,分别为:destination_grid_file.nc、source_grid_file.nc、weights_file.nc、wrfout_d01_2022-07-10_01:00:00.nc。其中,wrfout_d01_2022-07-10_01:00:00.nc是我需要的文件,但是其他三个文件如何在运行脚本的过程去掉暂未解决。
python格式转换脚本1
python脚本如下所示:
# -*- coding: utf-8 -*-
"""
Created on %(date)s

@author: %(jixianpu)s

Email : 211311040008@hhu.edu.cn

introduction : keep learning althongh walk slowly
"""
"""
用来读取用ncl插值后的wrfoutput.nc 数据,并生成对应文件名的json格式
"""
import pandas as pd
import os
import json
import netCDF4 as nc
import numpy as np
import  datetime
from netCDF4 import Dataset
import argparse
from argparse import RawDescriptionHelpFormatter
import xarray as xr
import sys
import glob

date = sys.argv[1]
date = str(date)
frst = sys.argv[2]
step = sys.argv[3]

path = r'/Users/WRF/outdata/2022071000/'#只能是已经存在的文件目录且有数据才可以进行读取
start = datetime.datetime.strptime(date,'%Y%m%d%H').strftime("%Y-%m-%d_%H:%M:%S")
end = (datetime.datetime.strptime(date,'%Y%m%d%H')+datetime.timedelta(hours=int(frst))).strftime("%Y-%m-%d_%H:%M:%S")
intp = (datetime.datetime.strptime(date,'%Y%m%d%H')+datetime.timedelta(hours=int(step))).strftime("%Y-%m-%d_%H:%M:%S")
fstart = path+'/wrfout_d01_'+start+'*'
fintp  = path+'/wrfout_d01_'+intp+'*'
fend   = path+'/wrfout_d01_'+end+'*'
file = path+'/*'
filestart = glob.glob(fstart)
fileintp  = glob.glob(fintp)
fileend   = glob.glob(fend)
filelist  = glob.glob(file)
filelist.sort()
rstart = np.array(np.where(np.array(filelist)==filestart))[0][0]
rintp = np.array(np.where(np.array(filelist)==fileintp))[0][0]
rend   = np.array(np.where(np.array(filelist)==fileend))[0][0]
fn = filelist[rstart:rend:rintp]
outroot = 'Users/'
for i in fn:
    uhdr = {"header":{"discipline":0,"disciplineName":"Meteorological products","gribEdition":2,"gribLength":131858,"center":0,"centerName":"WRF OUTPUT","subcenter":0,"refTime":"2014-01-31T00:00:00.000Z","significanceOfRT":1,"significanceOfRTName":"Start of forecast","productStatus":0,"productStatusName":"Operational products","productType":1,"productTypeName":"Forecast products","productDefinitionTemplate":0,"productDefinitionTemplateName":"Analysis/forecast at horizontal level/layer at a point in time","parameterCategory":2,"parameterCategoryName":"Momentum","parameterNumber":2,"parameterNumberName":"U-component_of_wind","parameterUnit":"m.s-1","genProcessType":2,"genProcessTypeName":"Forecast","forecastTime":3,"surface1Type":103,"surface1TypeName":"Specified height level above ground","surface1Value":10,"surface2Type":255,"surface2TypeName":"Missing","surface2Value":0,"gridDefinitionTemplate":0,"gridDefinitionTemplateName":"Latitude_Longitude","numberPoints":65160,"shape":6,"shapeName":"Earth spherical with radius of 6,371,229.0 m","gridUnits":"degrees","resolution":48,"winds":"true","scanMode":0,"nx":360,"ny":181,"basicAngle":0,"subDivisions":0,"lo1":0,"la1":90,"lo2":359,"la2":-90,"dx":1,"dy":1}}

    vhdr = {"header":{"discipline":0,"disciplineName":"Meteorological products","gribEdition":2,"gribLength":131858,"center":0,"centerName":"WRF OUTPUT","subcenter":0,"refTime":"2014-01-31T00:00:00.000Z","significanceOfRT":1,"significanceOfRTName":"Start of forecast","productStatus":0,"productStatusName":"Operational products","productType":1,"productTypeName":"Forecast products","productDefinitionTemplate":0,"productDefinitionTemplateName":"Analysis/forecast at horizontal level/layer at a point in time","parameterCategory":2,"parameterCategoryName":"Momentum","parameterNumber":3,"parameterNumberName":"V-component_of_wind","parameterUnit":"m.s-1","genProcessType":2,"genProcessTypeName":"Forecast","forecastTime":3,"surface1Type":103,"surface1TypeName":"Specified height level above ground","surface1Value":10,"surface2Type":255,"surface2TypeName":"Missing","surface2Value":0,"gridDefinitionTemplate":0,"gridDefinitionTemplateName":"Latitude_Longitude","numberPoints":65160,"shape":6,"shapeName":"Earth spherical with radius of 6,371,229.0 m","gridUnits":"degrees","resolution":48,"winds":"true","scanMode":0,"nx":360,"ny":181,"basicAngle":0,"subDivisions":0,"lo1":0,"la1":90,"lo2":359,"la2":-90,"dx":1,"dy":1}}

    data = [uhdr, vhdr]
    newf = Dataset(i)
    lat = np.array(newf.variables['lat'])
    # print(fn,lat)
    lon = np.array(newf.variables['lon'])
    dys = np.diff(lat, axis = 0).mean(1)
    dy = float(dys.mean())
    dxs = np.diff(lon, axis = 1).mean(0)
    dx = float(dxs.mean())
    nx = float(lon.shape[1])
    ny = float(lat.shape[0])
    la1 = float(lat[-1, -1])
    la2 = float(lat[0, 0])
    lo1 = float(lon[0, 0])
    lo2 = float(lon[-1, -1])

    time =(newf.variables['time'])

    dates = nc.num2date(time[:],units=time.units)

    dt = pd.to_datetime(np.array(dates, dtype='datetime64[s]')).strftime("%Y%m%d%H%M%S")

    tms =pd.to_datetime(np.array(dates, dtype='datetime64[s]')).strftime("%Y-%m-%d_%H:%M:%S")
    for ti, time in enumerate(dt):

        datestr = (dt[0][:8])
        timestr = (dt[0][8:10])+'00'

        dirpath = outroot + date
        os.makedirs(dirpath, exist_ok = True)
        outpath = os.path.join(dirpath, '%s.json' % (i[-19:]))
        for u0_or_v1 in [0, 1]:

            h = data[u0_or_v1]['header']
            h['la1'] = la1
            h['la2'] = la2
            h['lo1'] = lo1
            h['lo2'] = lo2
            h['nx'] = nx
            h['ny'] = ny
            h['dx'] = dx
            h['dy'] = dy
            h['forecastTime'] = 0
            h['refTime'] = tms[0] + '.000Z'

            h['gribLength'] = 1538 + nx * ny * 2
            if u0_or_v1 == 0:
                data[u0_or_v1]['data'] = np.array(newf.variables['u10']).ravel().tolist()
            elif u0_or_v1 == 1:
                data[u0_or_v1]['data'] = np.array(newf.variables['v10']).ravel().tolist()
        if ti == 0:
            outf = open(outpath, 'w')
            json.dump(data, outf)
            outf.close()
        outf = open(outpath, 'w')
        json.dump(data, outf)
        outf.close()
上述脚本为Linux系统下运行,运行方式如下:
python xx.py 起报时间 时常 间隔
举个例子:
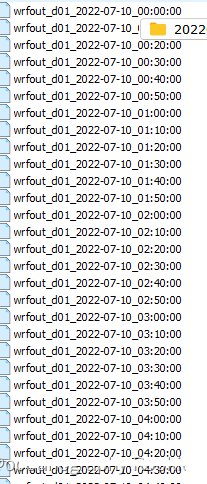
我的wrfout数据名称如下:
python convert_to_json.py 2022071000 12 06
根据你需要的模式起始时间,起报的时长(小时)以及预报的时间间隔(小时)进行自动化转换。
python 格式转换脚本2
当然,这里也准备了一个windows下的简易脚本,转换出的信息也比较简单,
# -*- coding: utf-8 -*-
"""
Created on %(date)s

@author: %(jixianpu)s

Email : 211311040008@hhu.edu.cn

introduction : keep learning althongh walk slowly
"""
from __future__ import print_function, unicode_literals
import pandas as pd
import os
import json
import netCDF4 as nc
import numpy as np
import  datetime
from netCDF4 import Dataset
import argparse
from argparse import RawDescriptionHelpFormatter
import xarray as xr
# parser = argparse.ArgumentParser(description = """
# """, formatter_class = RawDescriptionHelpFormatter)

args = r'J:/wrf自动化/wrfout_d01_2022-07-10_01_00_00.nc'

outroot = r'D:/'

uhdr = {"header":{
                  "nx":360,
                  "ny":181,
                  "max":11,
                  }}

data = [uhdr]
newf = Dataset(args)
lat = np.array(newf.variables['lat'])
lon = np.array(newf.variables['lon'])
u10 = np.array(newf.variables['u10'])
v10 = np.array(newf.variables['v10'])

# indx = u10>1000

# u10[indx] = np.nan
# v10[indx] = np.nan

w10 = np.nanmax(np.sqrt(u10*u10+v10*v10))

dys = np.diff(lat, axis = 0).mean(1)
dy =    float(dys.mean())
print('Latitude Error:', np.abs((dy / dys) - 1).max())
print('Latitude Sum Error:', (dy / dys - 1).sum())
dxs = np.diff(lon, axis = 1).mean(0)
dx =    float(dxs.mean())
print('Longitude Error:', np.abs(dx / dxs - 1).max())
print('Longitude Sum Error:', (dx / dxs - 1).sum())

nx =    float(lon.shape[1])
ny =    float(lat.shape[0])

la1 =    float(lat[-1, -1])
la2 =   float(lat[0, 0])
lo1 =   float(lon[0, 0])
lo2 =   float(lon[-1, -1])
time =(newf.variables['time'])
dates = nc.num2date(time[:],units=time.units)
dt = pd.to_datetime(np.array(dates, dtype='datetime64[s]')).strftime("%Y%m%d%H%M%S")

ds= {
                      "nx":360,
                      "ny":181,
                      "max":11,
                      # "lo1":0,
                      # "la1":90,
                      # "lo2":359,
                      # "la2":-90,
                      # "dx":1,
                      # "dy":1,
                      # "parameterUnit":"m.s-1",
                      'data':{}
        }

ds['max']   =    float(w10)
ds['nx']    =    (nx)
ds['ny']    =    (ny)
for ti, time in enumerate(dt):
    #2012/02/07/0100Z/wind/surface/level/orthographic=-74.01,4.38,29184
    datestr = (dt[0][:8])
    timestr = (dt[0][8:10])+'00'
    print('Add "#' + datestr + '/' + timestr + 'Z/wind/surface/level/orthographic" to url to see this time')
    dirpath = os.path.join('D:', *datestr.split('/'))
    os.makedirs(dirpath, exist_ok = True)
    outpath = os.path.join(dirpath, '%s-wind-surface-level-gfs-1.0.json' % (timestr,))
    udata=u10.ravel()
    data[0]['data']=[]
    for i in range(len(udata)):

        data[0]['data'].append([
        u10.ravel().tolist()[i],
        v10.ravel().tolist()[i]])

    ds['data'] = data[0]['data']

outf = open(outpath, 'w')
json.dump(ds,outf)
outf.close()
这个脚本正常放在编辑器里面运行即可。
运行完结束,会在你的输出路径下生成一个文件夹:

里面有个json数据:
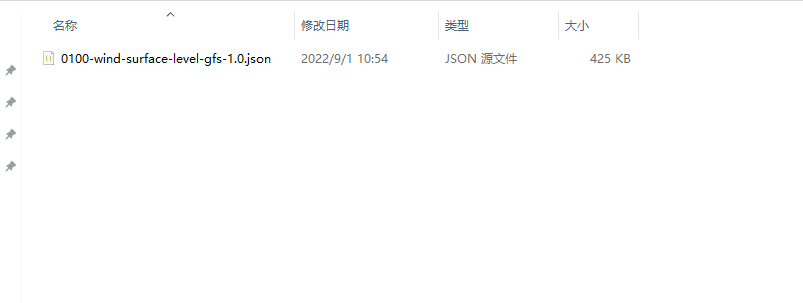
数据信息比较简单,只有nx(经度的大小),ny(纬度的大小)以及最大值:

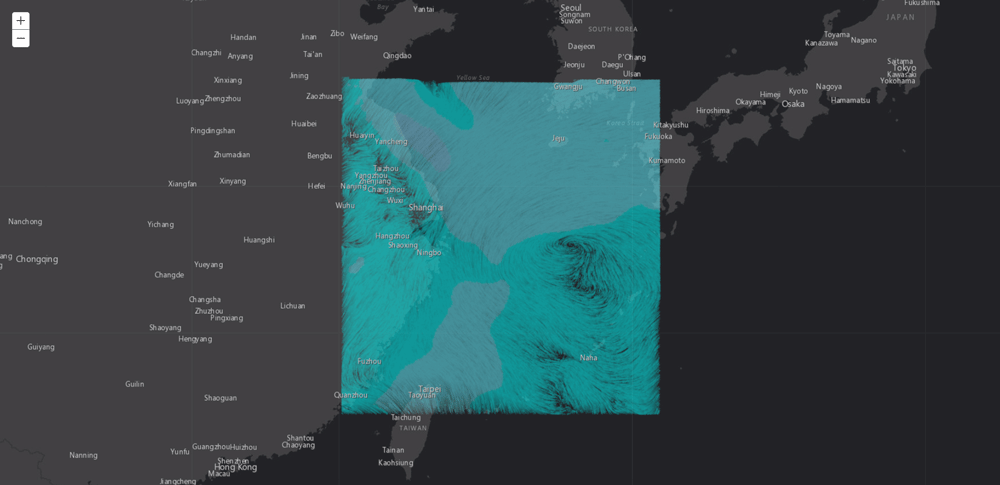
ok,以上就是完整的过程,最终将得到的json数据通过.js脚本运行就可以部署到网页上了,简单试了一下,大概如下图所示,可以根据需要自行更改设置:
到此这篇关于python转换wrf输出的数据为网页可视化json格式的文章就介绍到这了,更多相关python可视化json格式内容请搜索脚本之家以前的文章或继续浏览下面的相关文章希望大家以后多多支持脚本之家!