如何利用python正确地为图像添加高斯噪声
作者:howlclat
开门见山,直接使用 skimage 库为图像添加高斯噪声是很简单的:
import skimage

origin = skimage.io.imread("./lena.png")
noisy = skimage.util.random_noise(origin, mode='gaussian', var=0.01)
但是如果不用库函数而自己实现的话,有几个问题是值得注意的。
彩图 or 灰度图
读取图片时,图片可能是有三通道的RGB图片,也有可能是单通道的灰度图,甚至四通道的RGBA图。
通道数不同会影响图像数据的 shape ,例如: (256, 256, 3) 、(256, 256)
很多人按照MATLAB的习惯,使用 np.random.randn 来生成高斯噪声,则需要根据通道数调整参数。
# RGB
noise = sigma * np.random.randn(256, 256, 3)
# GRAY
noise = sigma * np.random.randn(256, 256)
为了通用的处理,最好使用 np.random.normal 生成高斯噪声。
noise = np.random.normal(mean, var ** 0.5, image.shape)
前两个参数分别为 均值和标准差,第三个参数为生成数据的 shape,直接将图像本身shape输入进去,更加优雅。
uint8 or float64
一般遇到的图像都是8bit的,用skimage或opencv读取后会发现数据类型是uint8的ndarray,取值范围是 [0, 255] 。
如果手贱直接在整型数据上添加高斯噪声,如:
image = io.imread("lena.png")
noise = np.random.normal(0, 10, image.shape)
noisy = image + noise
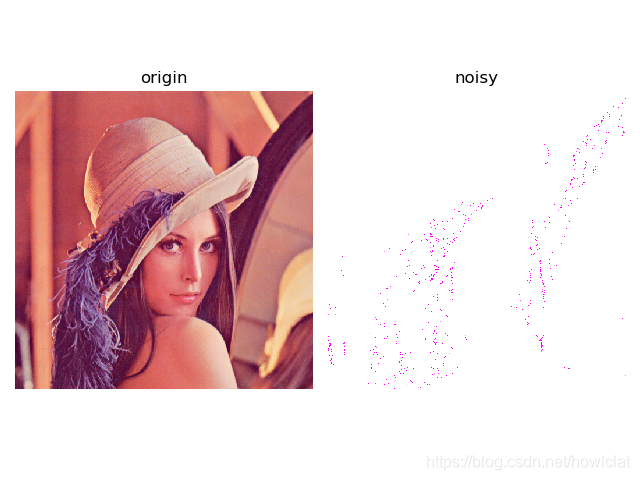
你会发现 plt.imshow 出来的是一片空白,或者有零星几个噪点。
以一个像素为例分析原因:
- 图像本身是[0, 255]的整数:[226 137 125]
- 生成的噪声是浮点数:[-2.92864248 4.04786763 12.23436435]
- 相加后最后的数据:[223.07135752 141.04786763 137.23436435]
matplotlib 的 imshow 要求输入是 (0-1 float or 0-255 int),所以上述不伦不类的数据是无法正确显示的(只显示了恰好落在0-1之间的像素)。

在很多应用中,为了方便计算,都会将图像数据转换为浮点数,float64,取值范围为 [0, 1]。
为了转换数据类型,最简单的方式是直接除以255:
image = io.imread("./lena.png")
print(image.dtype)					# uint8

image = image/255
print(image.dtype)					# float64
更稳妥的做法,可以使用skimage的img_to_float() :
image = img_as_float(image)
这样再添加高斯噪声就可以正确显示。
方差 or 标准差
高斯噪声符合一个均值为0,方差为 σ 2 \sigma^2 σ2 的高斯分布。
均值为0,是保证图像的亮度不会有变化,而方差大小则决定了高斯噪声的强度。
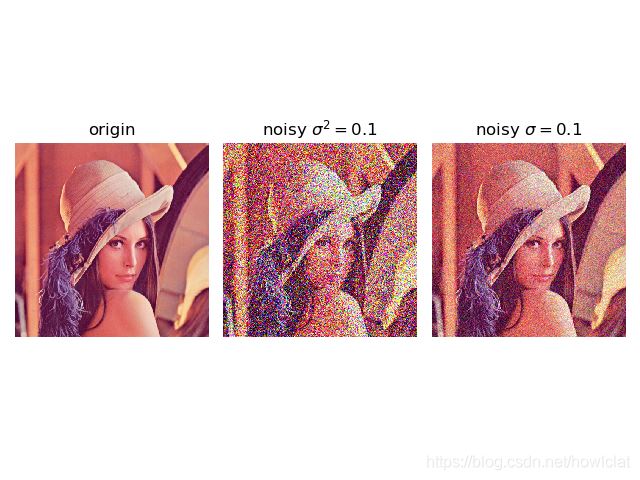
方差/标准差越大,噪声越强。
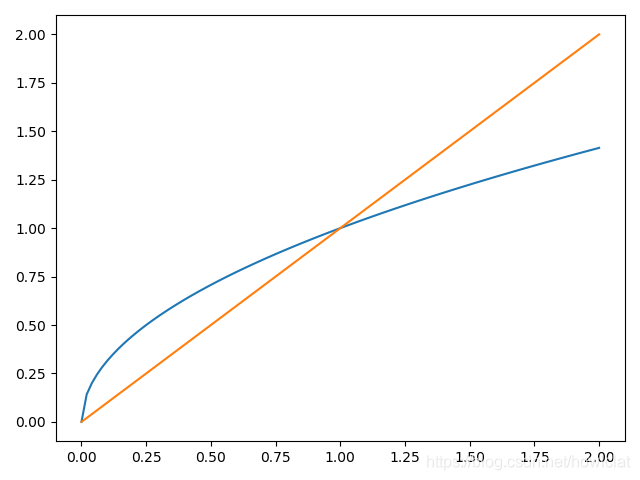
这里有一点点初中数学的细节,就是在[0, 1]区间内, y = x y=\sqrt{x} y=x 比 y = x y=x y=x 要大。

所以,设置方差为0.1,噪声要比设置标准差为0.1大不少。注意不要用混了就可以。

是否截断(clip)
由于需要把噪声叠加到原图像中,因此叠加后的数据值就可能超出对应数据类型的取值范围。
如果用matplotlib显示超出范围的彩色图像,则可能遇到以下提示:
Clipping input data to the valid range for imshow with RGB data ([0..1] for floats or [0..255] for integers).
matplotlib自动将图片做了截断。
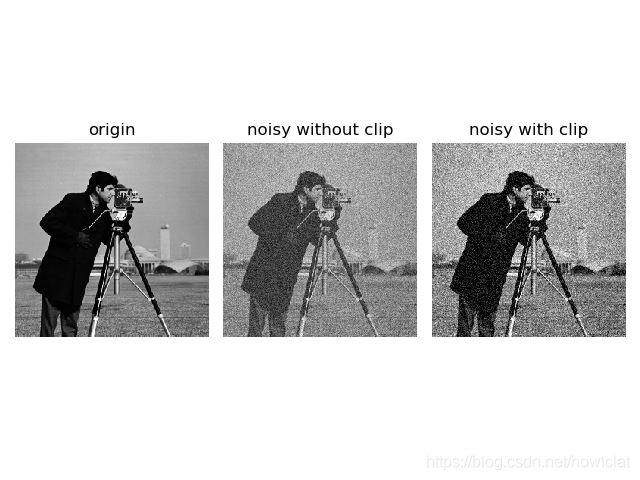
而不知为何,matplotlib并不会自动对灰度图进行截断,例如:

叠加噪声之后,图片数据的最小值和最大值分别为 -0.32 和 1.25,这明显超过了[0, 1]的范围。
这样显示出的图片是不正确的(中间图像),更像是重新将图像缩放到了[0, 1]范围内,就像将色阶向外扩了一样,对比度也下降了。
使用 np.clip,将图像截断到 [0, 1]之间,如右图所示,图像明显正常了很多。
总结
完整的代码如下:
from skimage import io, img_as_float
import numpy as np

mean = 0
var = 0.01

image = io.imread("./lena.png")

image = img_as_float(image)
noise = np.random.normal(mean, var**0.5, image.shape)
noisy = image + noise
noisy = np.clip(noisy, 0.0, 1.0)
当然,上述问题在 skimage.util.random_noise 中都已解决,工程中可以直接使用。
import skimage

origin = skimage.io.imread("./lena.png")
noisy = skimage.util.random_noise(origin, mode='gaussian', var=0.01)
推荐学习skimage的源码。
参考
https://zhuanlan.zhihu.com/p/50820267
https://www.jb51.net/article/241120.htm
https://matplotlib.org/3.1.1/api/_as_gen/matplotlib.pyplot.imshow.html
https://github.com/scikit-image/scikit-image/blob/v0.17.2/skimage/util/noise.py#L8
到此这篇关于如何利用python正确地为图像添加高斯噪声的文章就介绍到这了,更多相关python为图像加高斯噪声内容请搜索脚本之家以前的文章或继续浏览下面的相关文章希望大家以后多多支持脚本之家!
