Python库 Bokeh 数据可视化实用指南
作者:Python学习与数据挖掘
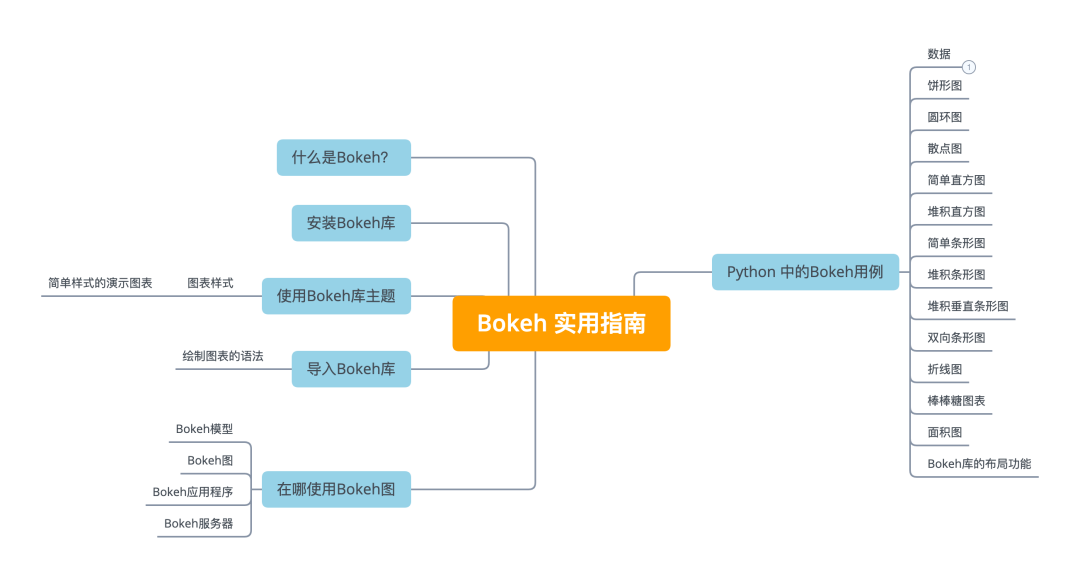
什么是 Bokeh
Bokeh 是 Python 中的交互式可视化库。Bokeh提供的最佳功能是针对现代 Web 浏览器进行演示的高度交互式图形和绘图。Bokeh 帮助我们制作出优雅、简洁的图表,其中包含各种图表。

Bokeh 主要侧重于将数据源转换为 JSON 格式,然后用作 BokehJS 的输入。Bokeh的一些最佳功能是:
- 灵活性: Bokeh 也为复杂的用例提供简单的图表和海关图表。
- 功能强: Bokeh 具有易于兼容的特性,可以与 Pandas 和 Jupyter 笔记本一起使用。
- 样式: 我们可以控制图表,我们可以使用自定义 Javascript 轻松修改图表。
- 开源: Bokeh 提供了大量的示例和想法,并在 Berkeley Source Distribution (BSD) 许可下分发。
使用Bokeh,我们可以轻松地将大数据可视化并以吸引人的优雅方式创建不同的图表。
在哪使用 Bokeh 图
有很多可视化库,为什么我们只需要使用Bokeh?我们可以使用 Bokeh 库在网页上嵌入图表。使用Bokeh,我们可以将图表嵌入网络、制作实时仪表板和应用程序。Bokeh 为图表提供了自己的样式选项和小部件。这是使用 Flask 或 Django 在网站上嵌入Bokeh图的优势。
安装Bokeh库
用pip安装Bokeh库,运行以下命令
pip install pandas-Bokeh
为conda环境安装Bokeh库,运行以下命令
conda install -c patrikhlobil pandas-Bokeh
导入Bokeh库
为Bokeh库导入必要的包。
import pandas as pd
# pip install pandas_Bokeh
import pandas_Bokeh
from Bokeh.io import show, output_notebook
from Bokeh.plotting import figure
pandas_Bokeh.output_notebook()
pd.set_option('plotting.backend', 'pandas_Bokeh')
Bokeh绘图是一个用于创建交互式视觉效果的界面,我们从中导入 它作为保存我们图表的容器。 figure
from Bokeh.plotting import figure
我们需要以下命令来显示图表。
from Bokeh.io import show, output_notebook
我们需要以下命令来在 jupyter notebook 中显示图表的输出。
pandas_Bokeh.output_notebook()
要将图表嵌入为 HTML,请运行以下命令。
pandas_bokeh.output_file(文件名)
Hovertool 用于在我们使用鼠标指针悬停在数据上时显示值, ColumnDataSource 是 DataFrame 的 Bokeh 版本。
from Bokeh.models import HoverTool, ColumnDataSource
绘制图表的语法
使用Pandas Bokeh
现在,通过以下代码将Bokeh绘图库用于 Pandas 数据框。
dataframe.plot_Bokeh()
为Bokeh创建 Figure 对象
我们将创建一个图形对象,它只不过是一个保存图表的容器。我们可以给 figure() 对象取任何名字,这里我们给了 fig.
fig = figure()
'''
自定义绘图代码
'''
show(fig)
使用 ColumnDataSource 创建图表
要将 ColumnDataSource 与渲染函数一起使用,我们至少需要传递 3 个参数:
- x – 包含图表 x 轴数据的 ColumnDataSource 列的名称
- y – 包含图表 y 轴数据的 ColumnDataSource 列的名称
- source – ColumnDataSource 列的名称,该列包含我们为 x 轴和 y 轴引用的数据
要在单独的 HTML 文件中显示输出图表,请运行以下命令。
output_file('abc.html')
使用Bokeh库主题
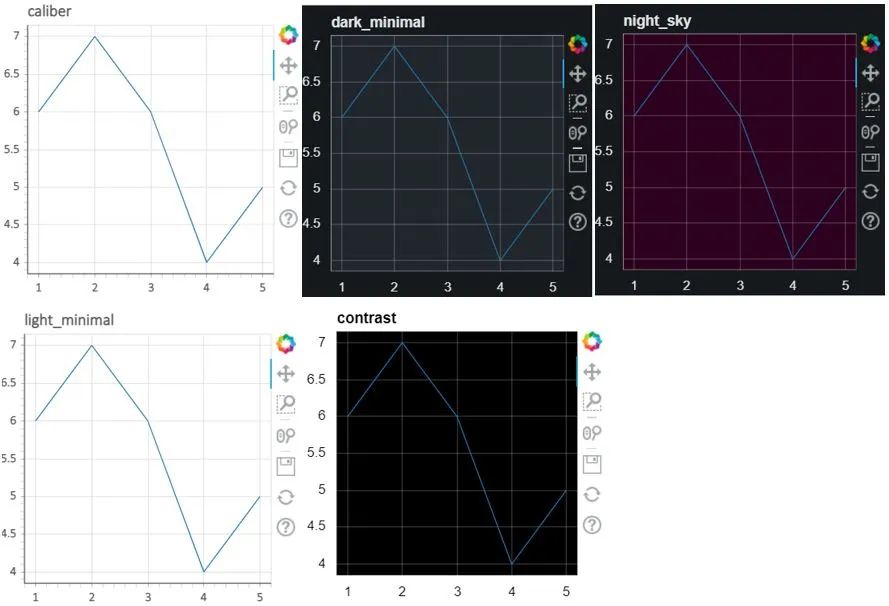
Bokeh主题有一组预定义的设计,可以将它们应用到您的绘图中。Bokeh 提供了五个内置主题。
- caliber,
- dark_minimal,
- light_minimal,
- night_sky,
- contrast.
下图显示了图表在内置主题中的外观。在这里,我采取了不同主题的折线图。
运行以下代码以使用内置主题绘制图表。
图表样式
为了增强图表,我们可以使用不同的属性。对象共有的三组主要属性:
- 线属性
- 填充属性
- 文本属性
基本造型
我将只添加自定义图表所需的代码,您可以根据需要添加代码。最后,我将展示带有演示代码的图表,以便清楚地理解。好吧,还有更多属性的详细解释请参见官方文档。
为图表添加背景颜色。
fig = figure(background_fill_color="#fafafa")
设置图表宽度和高度的值我们需要在figure()中添加高度和宽度。
fig = figure(height=350, width=500)
隐藏图表的 x 轴和 y 轴。
fig.axis.visible=False
隐藏图表的网格颜色。
fig.grid.grid_line_color = None
要更改图表颜色的强度,我们使用 alpha 。
fig.background_fill_alpha=0.3
要为图表添加标题,我们需要在 figure() 中添加标题。
fig = figure(title="abc")
要添加或更改 x 轴和 y 轴标签,请运行以下命令。
fig.xaxis.axis_label='X-axis'
fig.yaxis.axis_label='Y-axis'
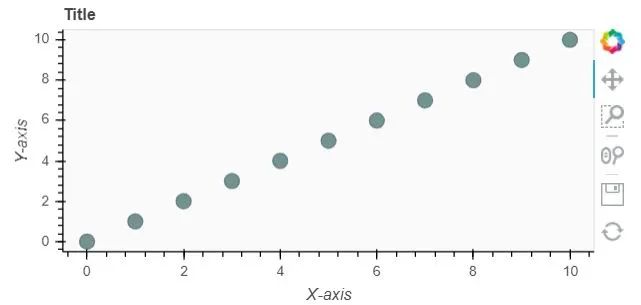
简单样式的演示图表
x = list(range(11))
y0 = x

fig = figure(width=500, height=250,title='Title',background_fill_color="#fafafa")

fig.circle(x, y0, size=12, color="#53777a", alpha=0.8)
fig.grid.grid_line_color = None
fig.xaxis.axis_label='X-axis'
fig.yaxis.axis_label='Y-axis'

show(fig)
使用 Bokeh.plotting 界面创建图表的步骤是:
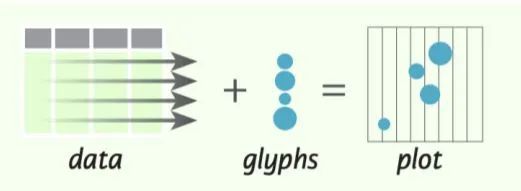
- 准备数据
- 创建一个新的情节
- 为您的数据添加渲染,以及您对绘图的可视化自定义
- 指定生成输出的位置(在 HTML 文件中或在 Jupyter Notebook 中)
- 显示结果
Python 中的 Bokeh用例
数据
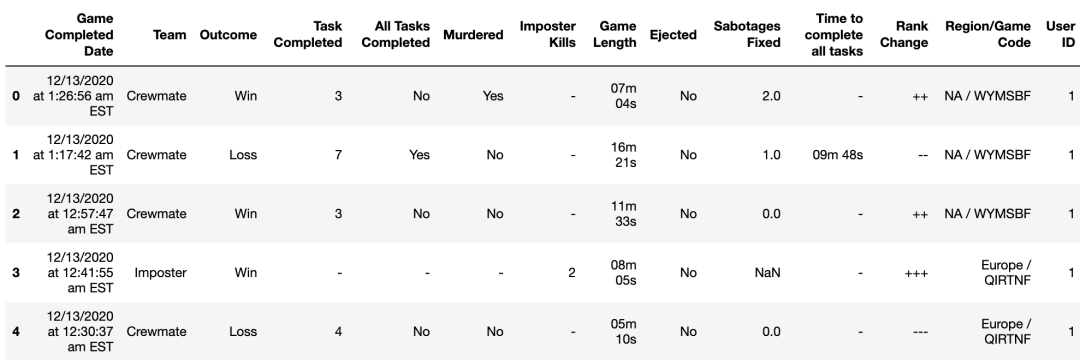
让我们加载数据并再创建一个特征User ID;用户 id 会告诉我们它像用户 1、用户 2 等哪个用户。
import glob
path = 'archive'
all_files = glob.glob(path + "/*.csv")
li = []
usr=0
for filename in all_files:
    usr+=1
    df = pd.read_csv(filename, index_col=None, header=0)
    df['User ID']=usr
    li.append(df)
df = pd.concat(li, axis=0, ignore_index=True)
df[:2]
数据说明
- Game Completed Date-游戏完成的日期和时间
- Team团队- 告诉我们玩家是冒名顶替者还是船员
- Outcome结果- 告诉我们游戏是否赢/输
- Task Completed已完成的任务 - 船员完成的任务数
- All Tasks Completed – 布尔变量显示所有任务是否由船员完成
- Murdered谋杀- 船员是否被谋杀
- Imposter Kills冒名顶替者杀死 – 冒名顶替者的击杀次数
- Game Length游戏时长——游戏的总持续时间
- Ejected - 玩家是否被其他玩家驱逐
- Sabotages Fixed – 船员修复的破坏次数
- Time to complete all tasks完成所有任务的时间——船员完成任务所用的时间
- Rank Change排名变化- 比赛输/赢后排名的变化
- Region/Game Code地区/游戏代码- 服务器和游戏代码
- User ID用户 ID –用户数量。
注意:本文不包含 EDA,但展示了如何在 Bokeh 中使用不同的图表
看看数据的分布。
df.describe(include='O')

我们将创建一个特征 Minute 并从 Game Lenght 中提取数据。
df['Min'] = df.apply(lambda x : x['Game Length'].split(" ")[0] , axis = 1)
df['Min'] = df['Min'].replace('m', '', regex=True)
df['Min'][:2]
0    07
1    16
Name: Min, dtype: object
现在,我们将替换 Murdered 特征的值。
df['Murdered'].replace(['No', 'Yes', '-'], ['Not Murdered', 'Murdered', 'Missing'],inplace=True)
完成必要的清洁步骤后。首先,让我们看看Bokeh中的基本图表。
饼形图
检查一下游戏中是否有更多的船员或冒名顶替者,我们有总共 2227 人的数据。
df_team = df.Team.value_counts()
df_team.plot_Bokeh(kind='pie', title='Ration of Mposter vs Crewmate')
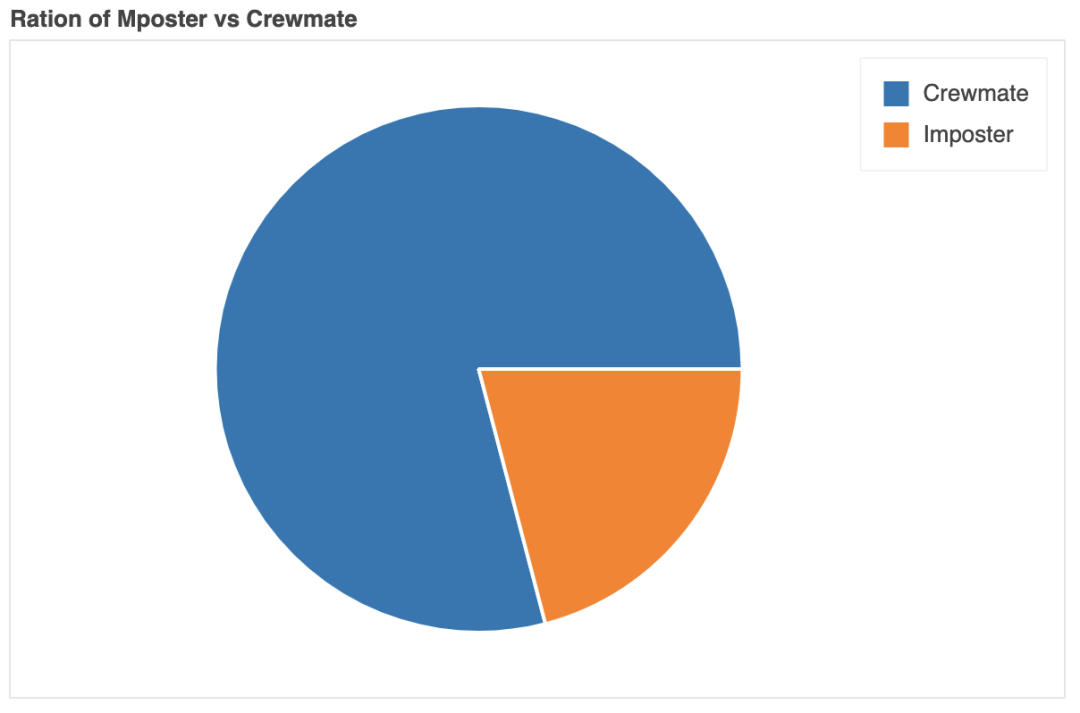
如图所示,Cremates 占 79%,Imposters 占 21%,由此可见 Imposter: Crewmates 的比例为1:4。冒名顶替者较少,因此有可能赢得大部分比赛。
圆环图
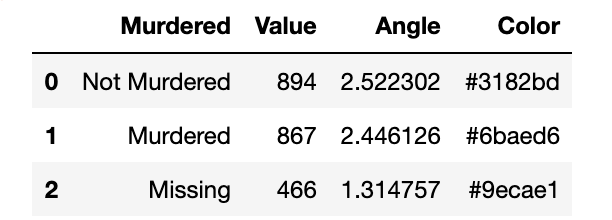
检查游戏中是否有更多的船员或冒名顶替者被谋杀。我们将添加两个我们将在图表中使用的功能 Angle 和 Color。
from math import pi
df_mur = df.Murdered.value_counts().reset_index().rename(columns={'index': 'Murdered', 'Murdered': 'Value'})
df_mur['Angle'] = df_mur['Value']/df_mur['Value'].sum() * 2*pi
df_mur['Color'] = ['#3182bd', '#6baed6', '#9ecae1']

df_mur
将用annular_wedge()做一个圆环图。
from Bokeh.transform import cumsum

fig = figure(plot_height=350,
             title="Ration of Murdered vs Not Murdered",
             toolbar_location=None,

tools="hover", tooltips="@Murdered: @Value", x_range=(-.5, .5))
fig.annular_wedge(x=0, y=1, inner_radius=0.15,
                  outer_radius=0.25, direction="anticlock",

start_angle=cumsum('Angle', include_zero=True),
                  end_angle=cumsum('Angle'),

line_color="white", fill_color='Color', legend_label='Murdered', source=df_mur)

fig.axis.axis_label=None
fig.axis.visible=False
fig.grid.grid_line_color = None
show(fig)
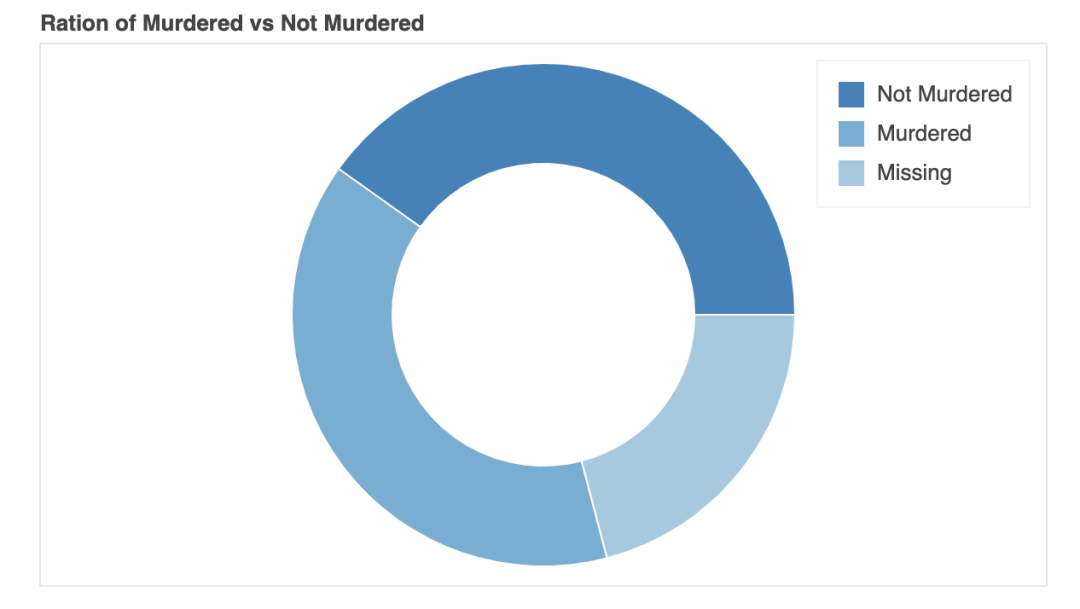
大多数人在游戏中被谋杀,但大部分数据丢失。所以我们不能说大多数人是在游戏中被谋杀的。
散点图
首先,将创建 Sabotages fixed 和 Minutes 的数据框,并更改列名并在其中添加 T。
df_min = pd.crosstab(df['Min'], df['Sabotages Fixed']).reset_index()
df_min = df_min.rename(columns={0.0:'0T', 1.0:'1T',
                       2.0:'2T',3.0:'3T',4.0:'4T',5.0:'5T'
                    })
df_min[:2]

将 3 次破坏固定为 0,1 和 2 并创建一个数据框。
df_0 = df_min[['Min', '0T']]
df_1 = df_min[['Min', '1T']]
df_2 = df_min[['Min', '2T']]
要制作只有一个图例的简单散点图,我们可以传递数据并使用scatter()它来制作图表。
df_min.plot_Bokeh.scatter(x='Min', y='1T')
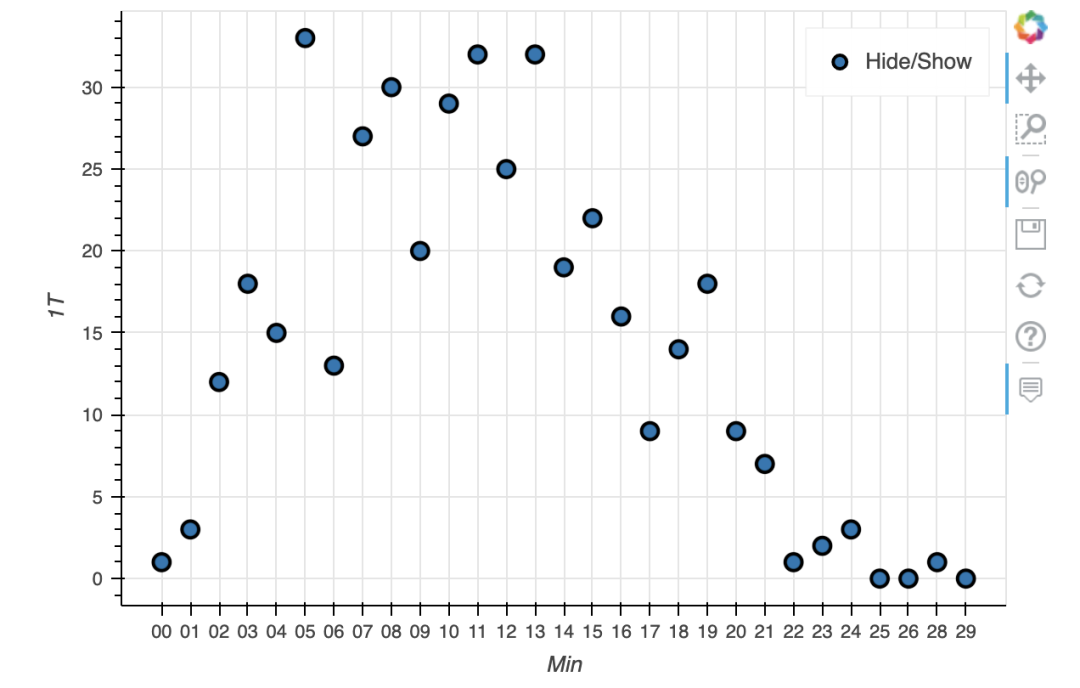
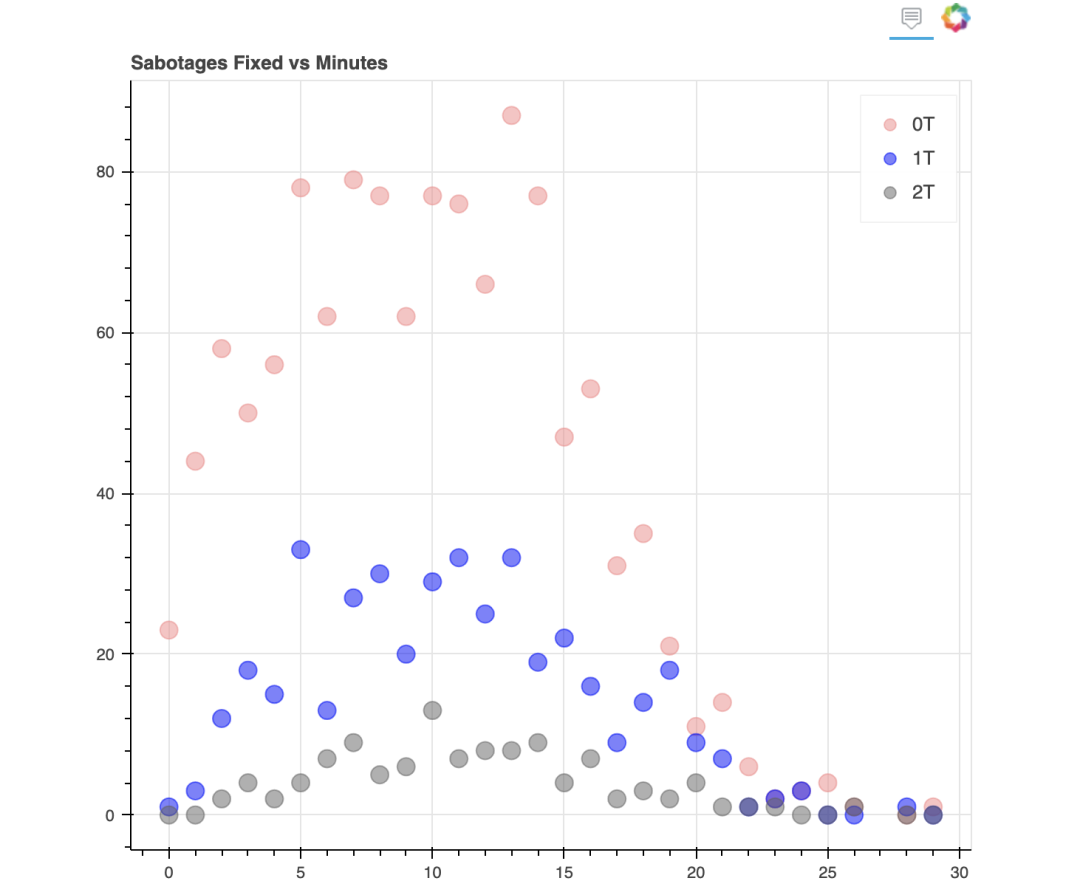
要制作包含多个图例的散点图,我们需要使用圆圈;这是图形对象的一种方法。圆圈是Bokeh提供的众多绘图样式之一,您可以使用三角形或更多。
fig = figure(title='Sabotages Fixed vs Minutes',
             tools= 'hover',
             toolbar_location="above",
             toolbar_sticky=False)
fig.circle(x="Min",y='0T',
         size=12, alpha=0.5,
         color="#F78888",
         legend_label='0T',
         source=df_0),
fig.circle(x="Min",y='1T',
         size=12, alpha=0.5,
         color="blue",
         legend_label='1T',
         source=df_1),
fig.circle(x="Min",y='2T',
         size=12, alpha=0.5,
         color="#626262",
         legend_label='2T',
         source=df_2),
show(fig)
简单直方图
看看游戏之间的分钟分布。将用hist来绘制直方图。
df_minutes = df['Min'].astype('int64')
df_minutes.plot_Bokeh(kind='hist', title='Distribution of Minutes')
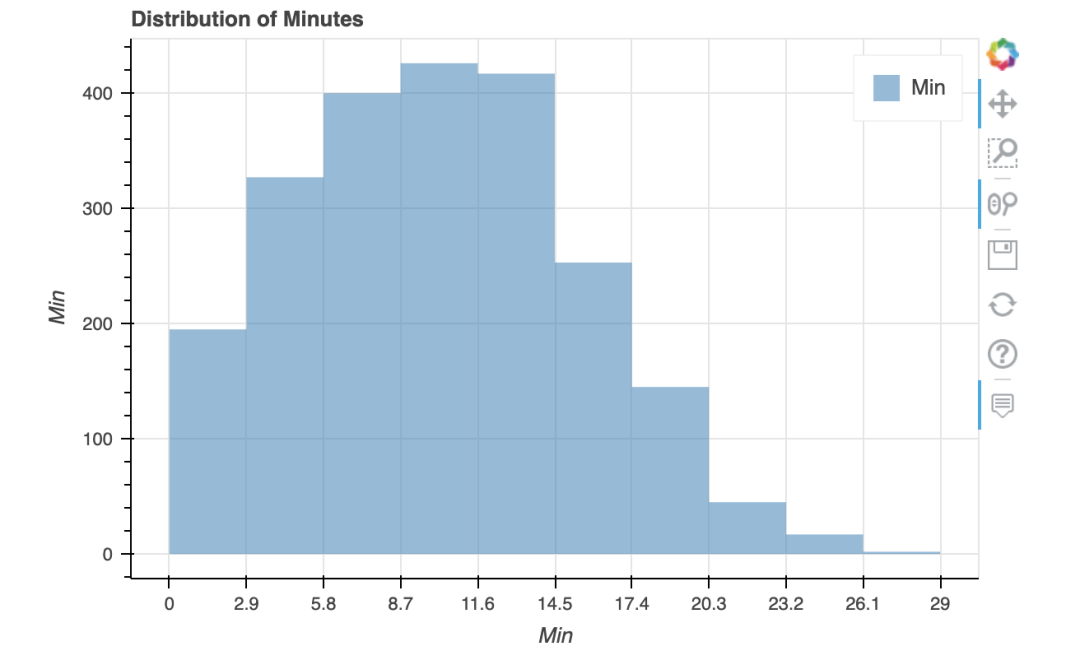
大多数比赛有6分钟到14分钟的时间。
堆积直方图
看看游戏长度是否会增加,因此冒名顶替者和船员会减少还是增加。我们将使用 hist来制作堆叠直方图。
df_gm_te = pd.crosstab(df['Game Length'], df['Team'])
df_gm_te
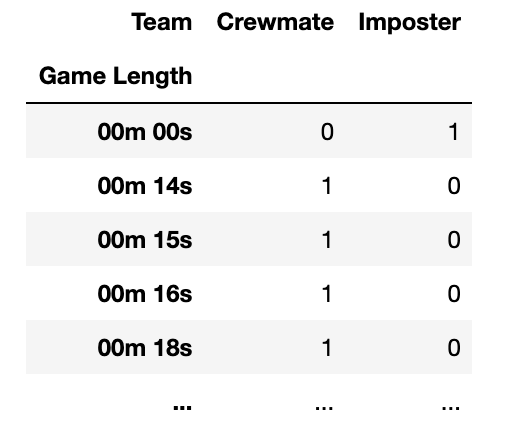
df_gm_te.plot_Bokeh.hist(title='Gamelegth vs Imposter/Crewmate', figsize=(750, 350))
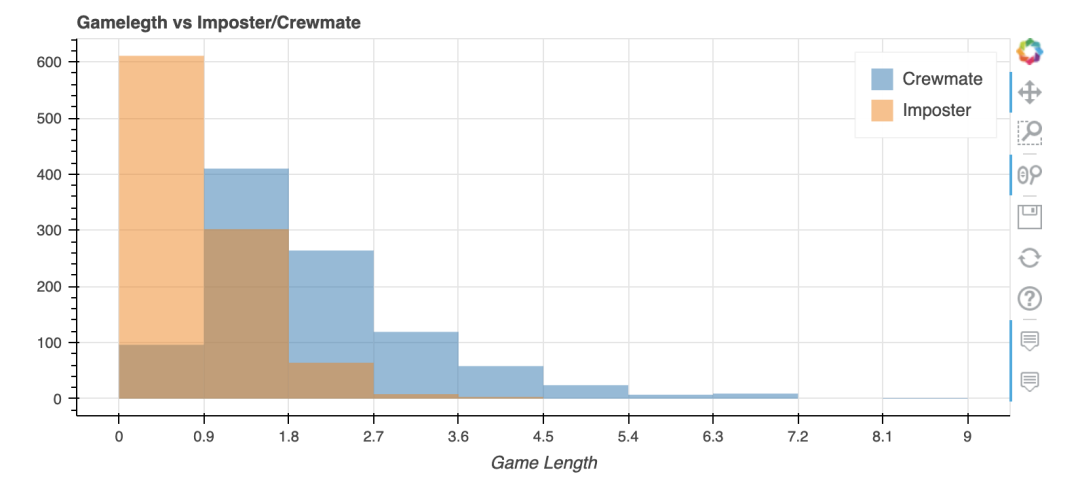
Bokeh中的堆叠直方图
冒名顶替者不倾向于长时间玩游戏,他们只想杀死所有火葬并赢得游戏。
不同类型的条形图
简单条形图
看看给定的任务是否由人完成。如果所有任务都完成,那么自动火葬将获胜。
df_tc = pd.DataFrame(df['Task Completed'].value_counts())[1:].sort_index().rename(columns={'Task Completed': 'Count'})
df_tc.plot_Bokeh(kind='bar', y='Count', title='How many people have completed given task?', figsize=(750, 350))
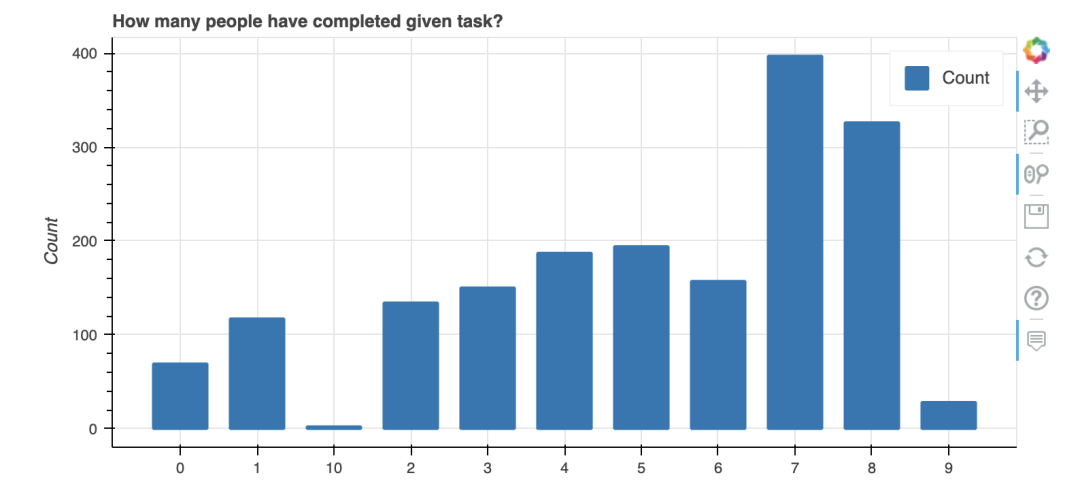
Bokeh中的条形图
完成最多的任务是 7 个,完成最少的任务是 10 个。
堆积条形图
看看谁赢了:冒名顶替者或火葬。我一直觉得冒名顶替者获胜最多,因为他们只有一份工作可以杀死所有人。
df1 = pd.crosstab(df['Team'], df['Outcome'])
df1.plot_Bokeh.bar(title='Who wins: Imposter or Crewmates',stacked=True,
figsize=(550, 350))
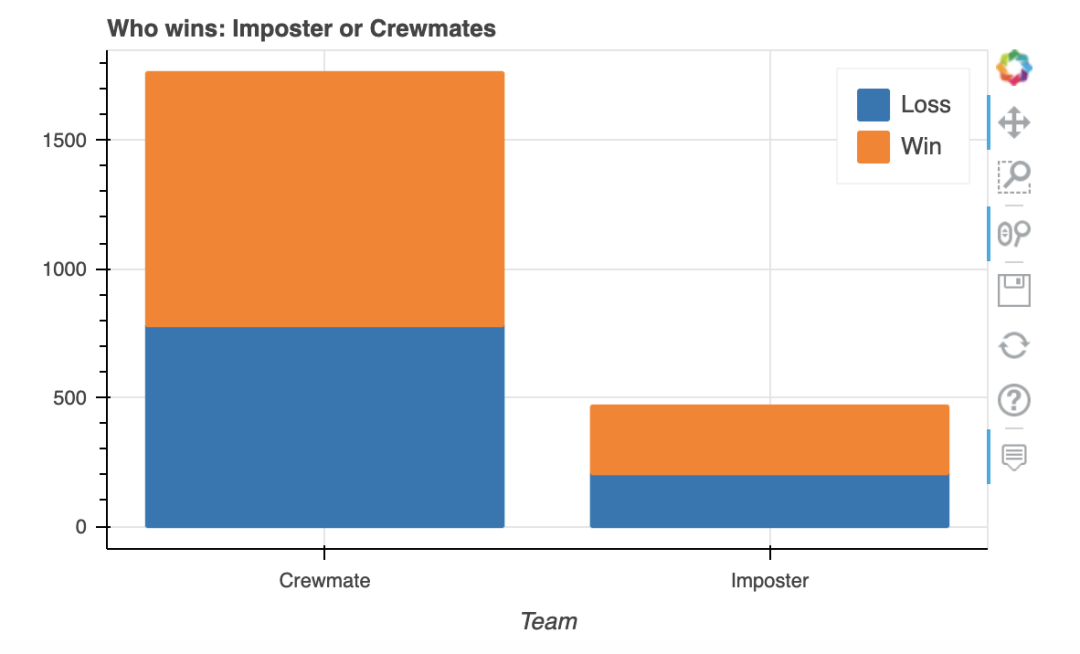
Bokeh中的堆积条形图
冒名顶替者比 Crewmates 赢得更多。Imposter赢得或输掉比赛没有太大区别,价值非常接近。很多情况下,他们有5个火葬场和4个冒名顶替者。
堆积垂直条形图
完成任务会不会赢得比赛让我们拭目以待。
df['All Tasks Completed'].replace(['Yes','No'], ['Tasks Completed','Tasks Not Completed'], inplace=True)

df2 = pd.crosstab(df['Outcome'], df['All Tasks Completed'])
df2.plot_Bokeh.barh(title='Completeing task: win or loss', stacked=True,
figsize=(650, 350))
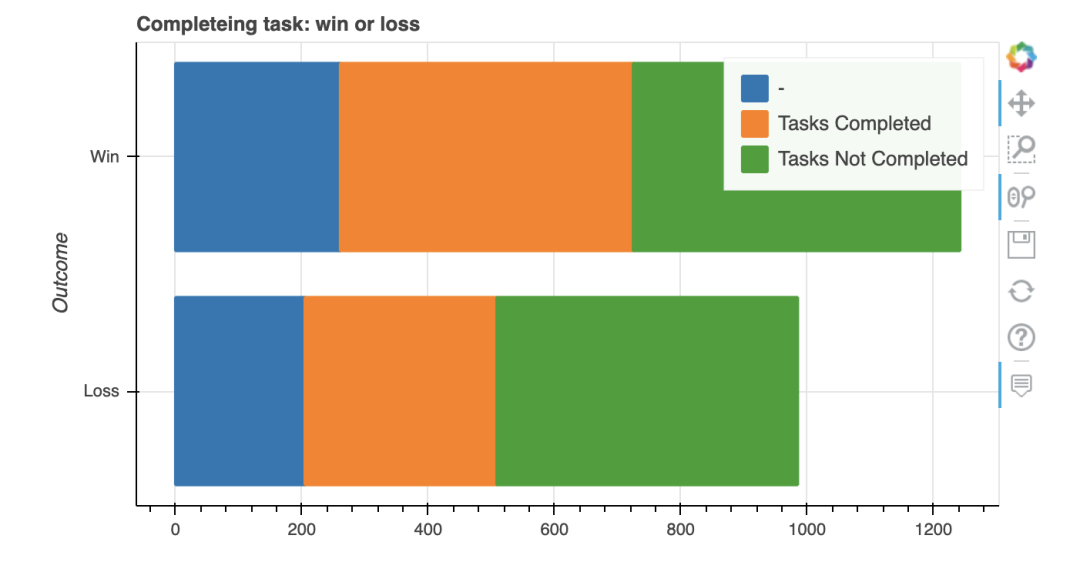
Bokeh中的堆积条形图
完成任务将自动赢得火葬。完成任务赢得比赛的人数更多。
双向条形图
用双向条形图看看用户是赢了还是输了。要制作双向条形图,我们需要将一个度量设为负值,这里我们将损失特征设为负值。
df_user = pd.crosstab(df['User ID'], df['Outcome']).reset_index()
df_user['Loss'] = df_user['Loss']*-1
df_user['User ID'] = (df_user.index+1).astype(str) + ' User'
df_user = df_user.set_index('User ID')
df_user[:2]
现在完成上面的过程后,我们只需要barh() 在两个方向上制作一个条形图即可。
df_user.plot_Bokeh.barh(title='Users: Won or Defeat')
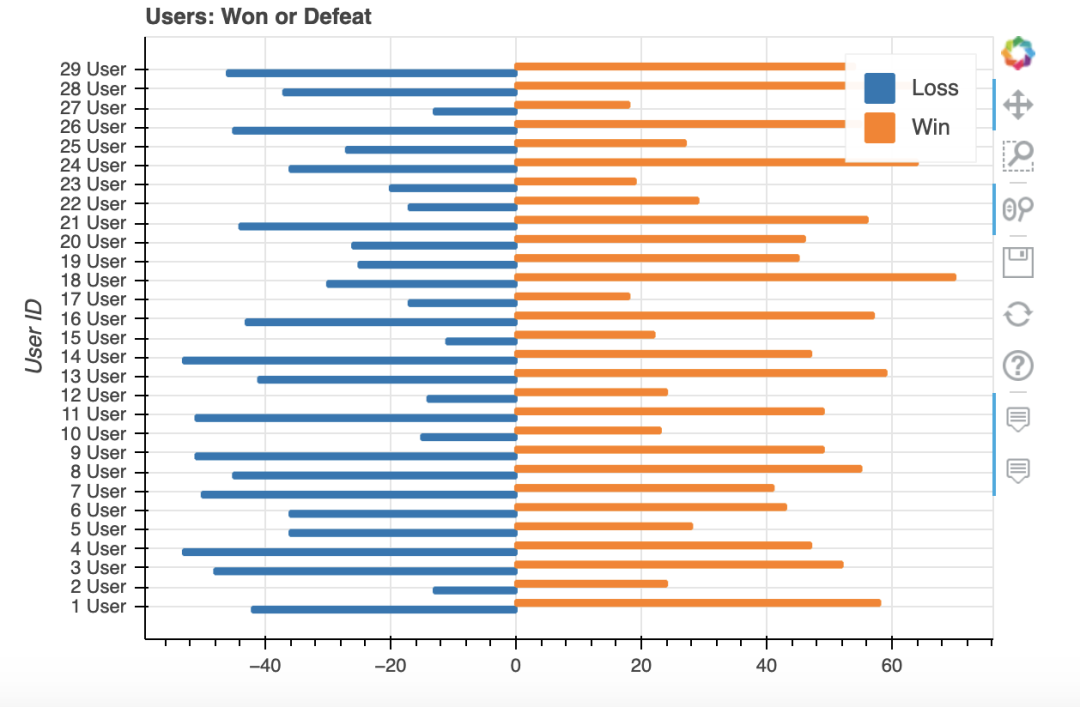
Bokeh中的双向条形图
从图表中,我们可以轻松区分用户是被击败还是赢得了比赛。
折线图
看看游戏中火化的排出比例。我们将line 用来制作折线图。
df_crewmate = df[df['Team'] == 'Crewmate']
df_t_ej = pd.crosstab(df_crewmate['User ID'], df_crewmate['Ejected']).reset_index()
df_t_ej = df_t_ej[['No','Yes']]
df_t_ej.plot_Bokeh.line(title='Cremates Memebers: Ejected vs Minutes', figsize=(750, 350))
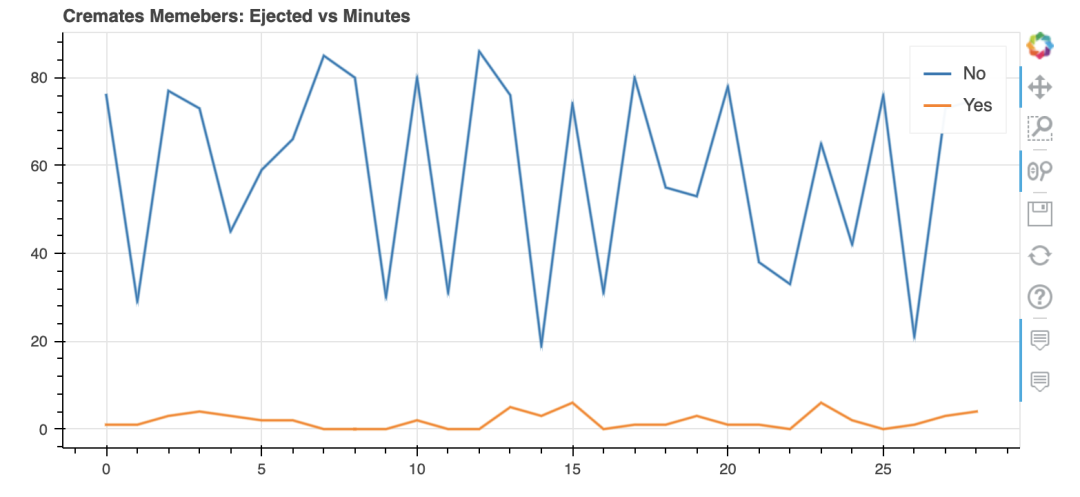
Bokeh中的折线图
没有被逐出游戏的成员存在很大差异。
棒棒糖图表
将获胜的前 10 名用户的图表可视化。我在所有用户 ID 中添加了一个用户字符串。数据框看起来像这样。
df_user_new = pd.crosstab(df['User ID'], df['Outcome']).reset_index().sort_values(by='Win', ascending=False)[:10]
df_user_new['User ID'] = (df_user_new.index+1).astype(str) + ' User'
df_user_new[:2]
在此图表中,我们将从图表中删除 x 轴和 y 轴网格线。为了制作棒棒糖图表,我们需要结合 segment() 和circle()。
x = df_user_new['Win']

factors = df_user_new['User ID'] #.values
fig = figure(title="Top 10 Users: Win", toolbar_location=None,tools="hover", tooltips="@x",
y_range=factors, x_range=[0,75],
plot_width=750, plot_height=350)

fig.segment(0, factors, x, factors, line_width=2, line_color="#3182bd")
fig.circle(x, factors, size=15, fill_color="#9ecae1", line_color="#3182bd", line_width=3)
fig.xgrid.grid_line_color = None
fig.ygrid.grid_line_color = None
show(fig)
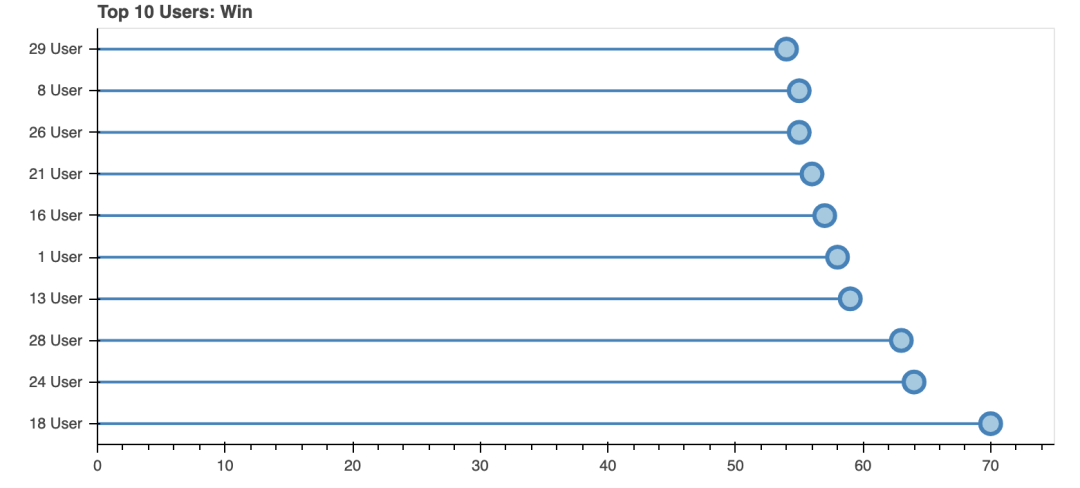
Bokeh中的棒棒糖图
面积图
看看在这段时间(分钟)内修复了多少破坏事件。在这里为了简单起见,我们将只看到两个破坏活动 0th 和 1st。
from Bokeh.models import ColumnDataSource
from Bokeh.plotting import figure, output_file, show

# data
df_min = pd.crosstab(df['Min'], df['Sabotages Fixed']).reset_index()
df_min = df_min.rename(columns={0.0:'0T', 1.0:'1T',2.0:'2T',3.0:'3T',4.0:'4T',5.0:'5T'})

# chart
names = ['0T','1T']
source = ColumnDataSource(data=dict(x = df_min.Min,
                                    y0 = df_min['0T'],
                                    y1 = df_min['1T']))

fig = figure(width=400, height=400, title='Sabotages Fied vs Minutes')
fig.varea_stack(['y0','y1'], x='x', color=("grey", "lightgrey"),legend_label=names, source=source)

fig.grid.grid_line_color = None
fig.xaxis.axis_label='Minutes'

show(fig)
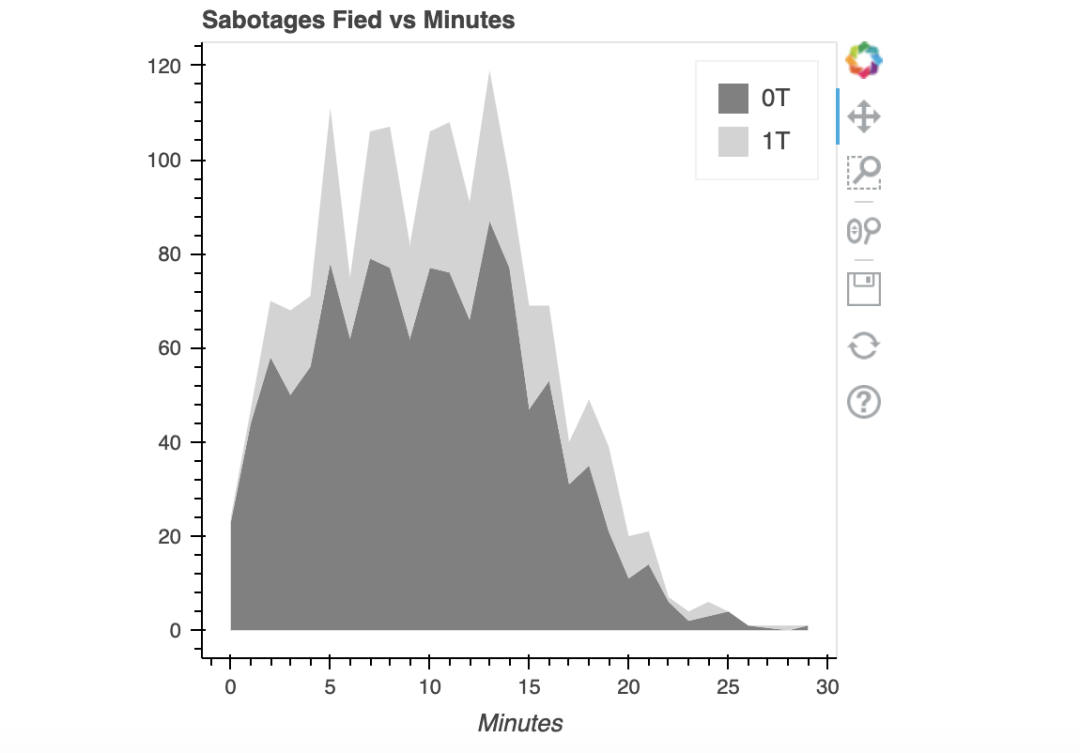
Bokeh中的面积图
随着时间的增加,破坏活动会减少。
到目前为止,我们已经看到了Bokeh中的所有基本图表,现在看看如何在Bokeh中使用布局。这将帮助我们创建仪表板或应用程序。因此,我们可以将特定用例的所有信息集中在一个地方。
Bokeh库的布局功能
Layout 函数将让我们构建一个由绘图和小部件组成的网格。我们可以在一个布局中拥有尽可能多的行和列或网格。
有许多可用的布局选项:
- 如果要垂直显示图,请使用**
column()**函数。 - 如果要水平显示图,请使用**
row()**函数。 - 如果您希望以网格方式绘制图形,请使用**
gridplot()**函数。 - 如果您希望图表以最佳方式放置,请使用**
layout()**函数
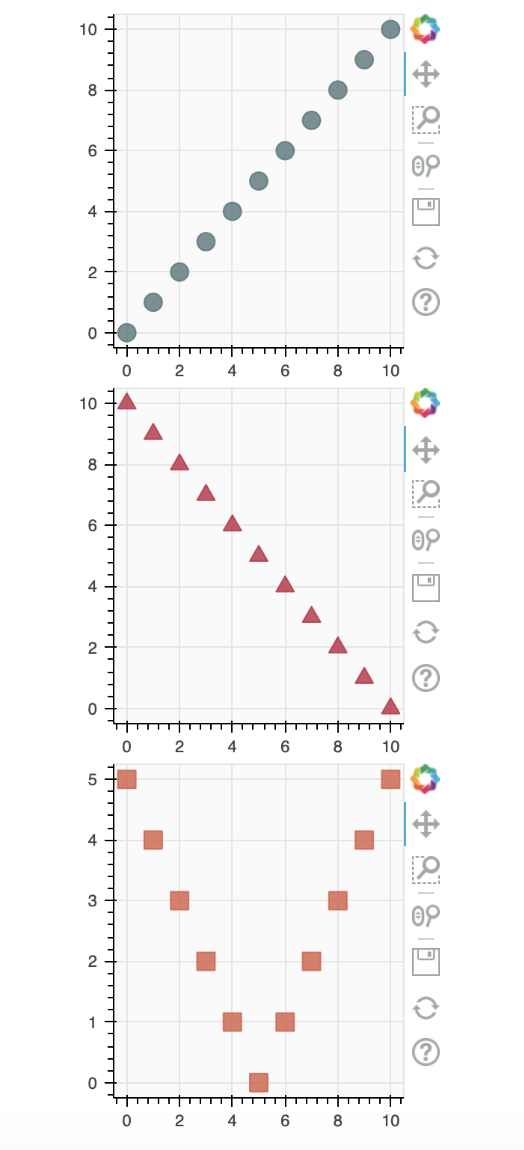
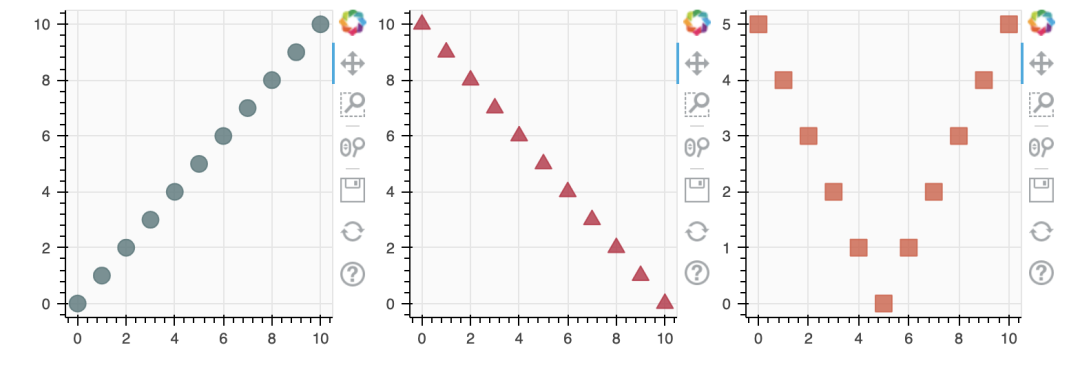
取一个虚拟数据。
from Bokeh.io import output_file, show
from Bokeh.layouts import row,column
from Bokeh.plotting import figure
output_file("layout.html")
x = list(range(11))
y0 = x
y1 = [10 - i for i in x]
y2 = [abs(i - 5) for i in x]
# create three plots
s1 = figure(width=250, height=250, background_fill_color="#fafafa")
s1.circle(x, y0, size=12, color="#53777a", alpha=0.8)
s2 = figure(width=250, height=250, background_fill_color="#fafafa")
s2.triangle(x, y1, size=12, color="#c02942", alpha=0.8)
s3 = figure(width=250, height=250, background_fill_color="#fafafa")
s3.square(x, y2, size=12, color="#d95b43", alpha=0.8)
如果我们使用 column() 函数,输出将如下所示。
show(column(s1, s2, s3))
如果我们使用 row() 函数,输出将如下所示。
# 将结果排成一行并显示
show(row(s1, s2, s3))
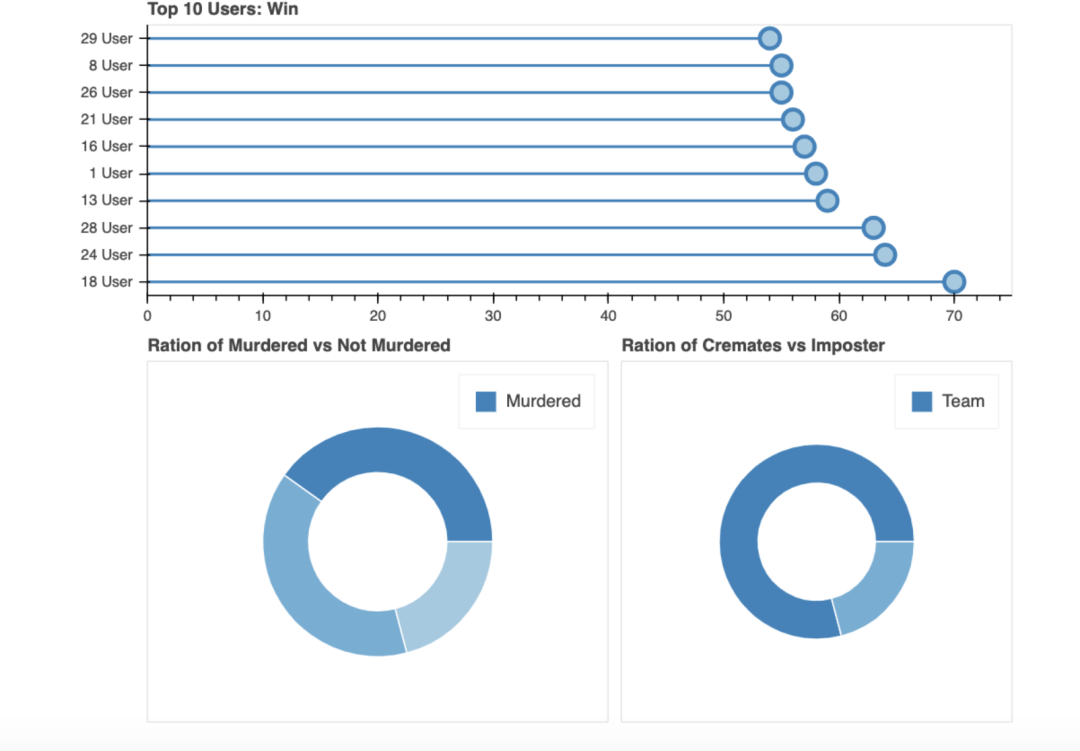
在 Bokeh 中制作仪表板布局。在这里我拍了三张图表,一张是棒棒糖图,另外两张是Bokeh的饼图。
在Bokeh中设置布局的主要逻辑是我们希望如何设置图表。创建一个如下图所示的设计。

layout = grid([[fig1],
               [fig2, fig3]])
在 Bokeh 中运行仪表板布局的整个代码。
from Bokeh.io import output_file, show
from Bokeh.plotting import figure
from Bokeh.layouts import column, grid
# 1 layout
df_user_new = pd.crosstab(df['User ID'], df['Outcome']).reset_index().sort_values(by='Win', ascending=False)[:10]
df_user_new['User ID'] = (df_user_new.index+1).astype(str) + ' User'
x = df_user_new['Win']
factors = df_user_new['User ID']
fig1 = figure(title="Top 10 Users: Win", toolbar_location=None,
              tools="hover", tooltips="@x",
              y_range=factors, x_range=[0,75],
              width=700, height=250)
fig1.segment(0, factors, x, factors, line_width=2, line_color="#3182bd")
fig1.circle(x, factors, size=15, fill_color="#9ecae1", line_color="#3182bd", line_width=3)
# 2 layout
df_mur = df.Murdered.value_counts().reset_index().rename(columns={'index': 'Murdered', 'Murdered': 'Value'})
df_mur['Angle'] = df_mur['Value']/df_mur['Value'].sum() * 2*pi
df_mur['Color'] = ['#3182bd', '#6baed6', '#9ecae1']
fig2 = figure(height=300,width=400, title="Ration of Murdered vs Not Murdered",
              toolbar_location=None, tools="hover", tooltips="@Murdered: @Value", x_range=(-.5, .5))
fig2.annular_wedge(x=0, y=1,  inner_radius=0.15, outer_radius=0.25, direction="anticlock",
                   start_angle=cumsum('Angle', include_zero=True), end_angle=cumsum('Angle'),
                   line_color="white", fill_color='Color', legend_label='Murdered', source=df_mur)
# 3 layout
df_team = pd.DataFrame(df.Team.value_counts()).reset_index().rename(columns={'index': 'Team', 'Team': 'Value'})
df_team['Angle'] = df_team['Value']/df_team['Value'].sum() * 2*pi
df_team['Color'] = ['#3182bd', '#6baed6']

fig3 = figure(height=300, width=300, title="Ration of Cremates vs Imposter",
              toolbar_location=None, tools="hover", tooltips="@Team: @Value", x_range=(-.5, .5))
fig3.annular_wedge(x=0, y=1,  inner_radius=0.15, outer_radius=0.25, direction="anticlock",
                   start_angle=cumsum('Angle', include_zero=True), end_angle=cumsum('Angle'),
                   line_color="white", fill_color='Color', legend_label='Team', source=df_team)
# Styling
for fig in [fig1, fig2, fig3]:
        fig.grid.grid_line_color = None
for fig in [fig2, fig3]:
        fig.axis.visible=False
        fig.axis.axis_label=None
layout = grid([
                [fig1],
                [fig2, fig3]
       ])
show(layout)
技术交流
欢迎转载、收藏、有所收获点赞支持一下!

到此这篇关于Python库 Bokeh 数据可视化实用指南的文章就介绍到这了,更多相关Python Bokeh数据可视化内容请搜索脚本之家以前的文章或继续浏览下面的相关文章希望大家以后多多支持脚本之家!
