
Aptana调试javascript图解教程
作者:
用Aptana软件来调试javascript的方法,一般情况下大家都使用firefox浏览器+firebug来调试的。
前提是安装 Firebug 插件 和aptanadebugger 插件,他们的下载地址如下:
http://getfirebug.com/releases/firebug/1.2/firebug-1.2.0.xpi
http://firefox.aptana.com/update/aptanadebugger.xpi
开始调试:
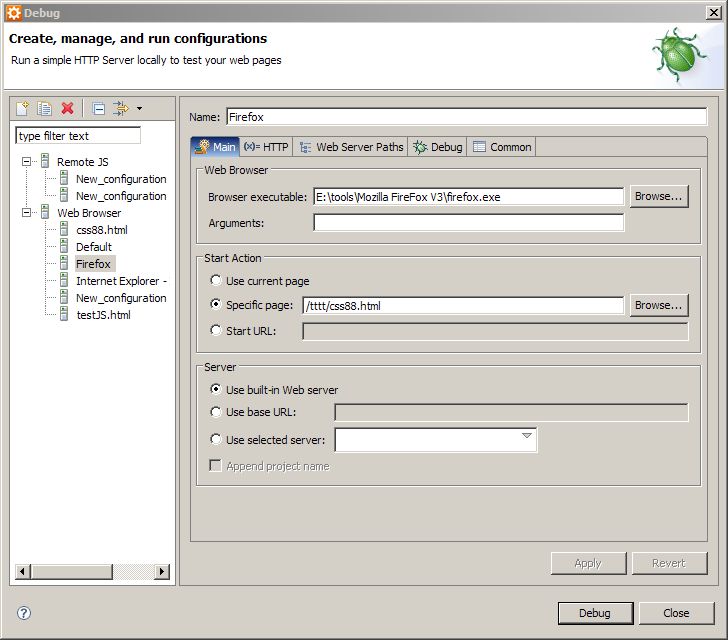
选择你所需要的调试的html文件,右键点击"Debug As" 下的 “Debug...” ,其中左侧菜单中要选用 “Web Browser”,右侧的"Main" 选项卡中的 "Browser executable"中一定要填写正确的firefox.exe文件的路径,其他的默认即可,如下图:
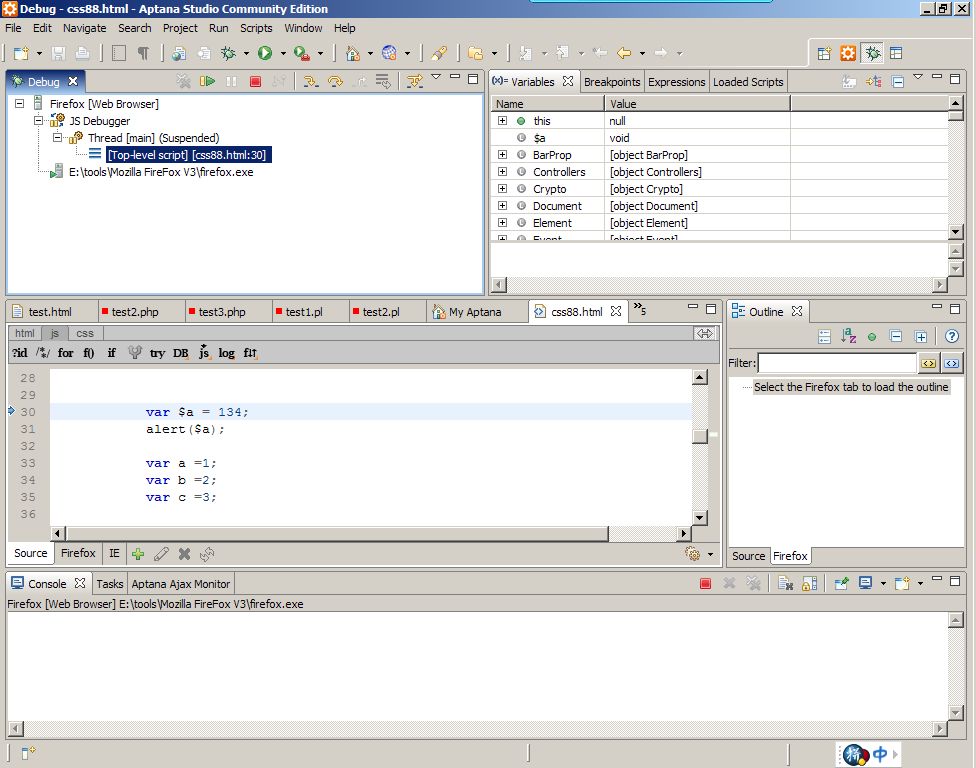
 点击 “Debug” 按钮进入调试视图,(aptana 同时会打开firefox浏览器),如下图:
 另外:
另外:
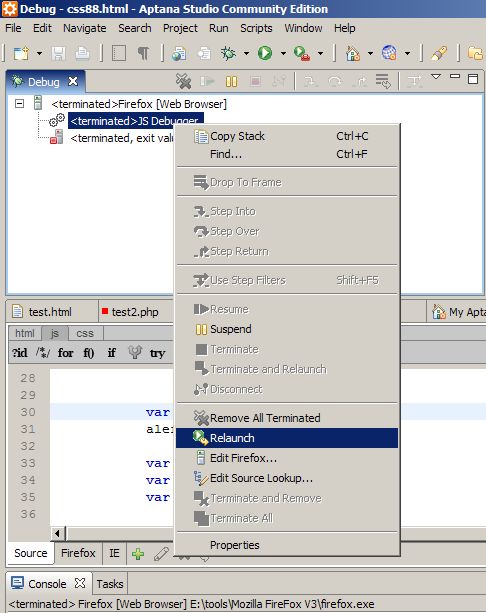
如果运行debug没有相应,可以右键点击“Relaunch” 在试,如图:
 有的时候在Debug选项面板中没有 "Web Browser" 菜单 只有 “Remote JS” 菜单,如图:
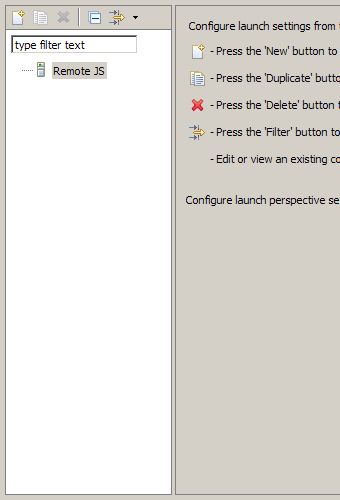 解决办法如下:
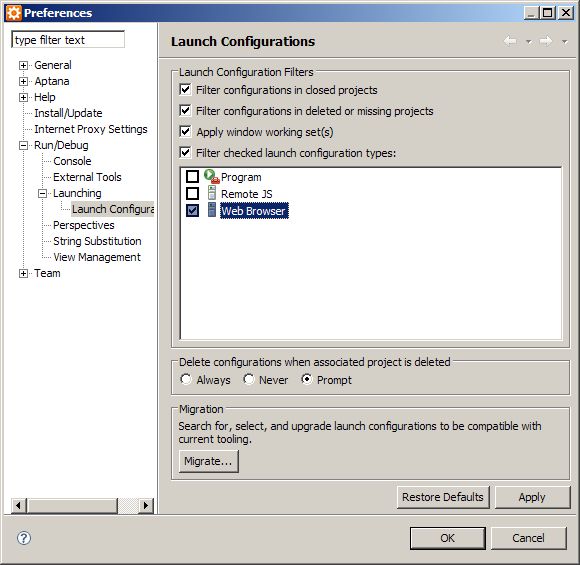
“Window” -> "Preferences" -> "Run/Debug" -> Launching -> Launch Configuration
将右侧 "Web Browser" 中的勾去掉。
http://getfirebug.com/releases/firebug/1.2/firebug-1.2.0.xpi
http://firefox.aptana.com/update/aptanadebugger.xpi
开始调试:
选择你所需要的调试的html文件,右键点击"Debug As" 下的 “Debug...” ,其中左侧菜单中要选用 “Web Browser”,右侧的"Main" 选项卡中的 "Browser executable"中一定要填写正确的firefox.exe文件的路径,其他的默认即可,如下图:
点击 “Debug” 按钮进入调试视图,(aptana 同时会打开firefox浏览器),如下图:另外:如果运行debug没有相应,可以右键点击“Relaunch” 在试,如图:
有的时候在Debug选项面板中没有 "Web Browser" 菜单 只有 “Remote JS” 菜单,如图:解决办法如下:“Window” -> "Preferences" -> "Run/Debug" -> Launching -> Launch Configuration
将右侧 "Web Browser" 中的勾去掉。
