python实现各种插值法(数值分析)
作者:Zhang_Raymond
这篇文章主要介绍了python实现各种插值法(数值分析),文中通过示例代码介绍的非常详细,对大家的学习或者工作具有一定的参考学习价值,需要的朋友们下面随着小编来一起学习学习吧
一维插值
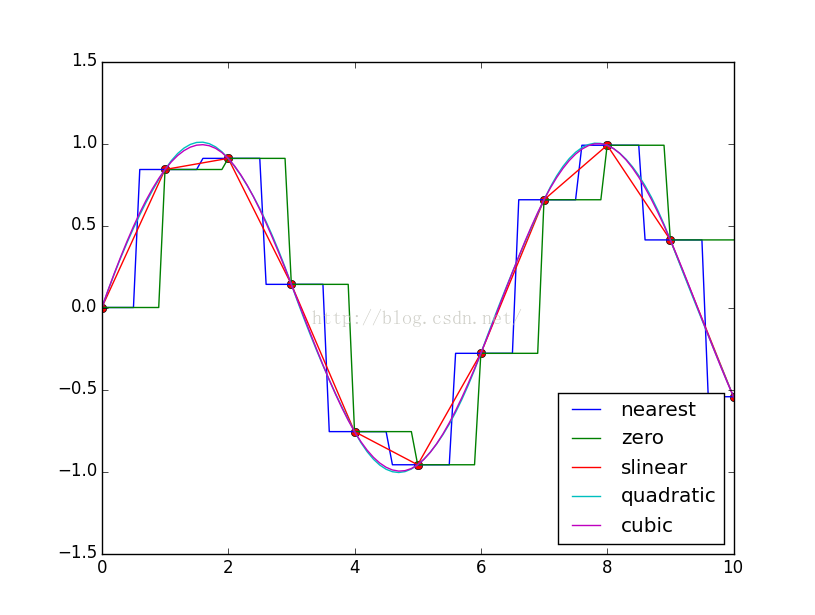
插值不同于拟合。插值函数经过样本点,拟合函数一般基于最小二乘法尽量靠近所有样本点穿过。常见插值方法有拉格朗日插值法、分段插值法、样条插值法。
- 拉格朗日插值多项式:当节点数n较大时,拉格朗日插值多项式的次数较高,可能出现不一致的收敛情况,而且计算复杂。随着样点增加,高次插值会带来误差的震动现象称为龙格现象。
- 分段插值:虽然收敛,但光滑性较差。
- 样条插值:样条插值是使用一种名为样条的特殊分段多项式进行插值的形式。由于样条插值可以使用低阶多项式样条实现较小的插值误差,这样就避免了使用高阶多项式所出现的龙格现象,所以样条插值得到了流行。
# -*-coding:utf-8 -*-
import numpy as np
from scipy import interpolate
import pylab as pl

x=np.linspace(0,10,11)
#x=[ 0. 1. 2. 3. 4. 5. 6. 7. 8. 9. 10.]
y=np.sin(x)
xnew=np.linspace(0,10,101)
pl.plot(x,y,"ro")

for kind in ["nearest","zero","slinear","quadratic","cubic"]:#插值方式
 #"nearest","zero"为阶梯插值
 #slinear 线性插值
 #"quadratic","cubic" 为2阶、3阶B样条曲线插值
 f=interpolate.interp1d(x,y,kind=kind)
 # ‘slinear', ‘quadratic' and ‘cubic' refer to a spline interpolation of first, second or third order)
 ynew=f(xnew)
 pl.plot(xnew,ynew,label=str(kind))
pl.legend(loc="lower right")
pl.show()
结果:

二维插值
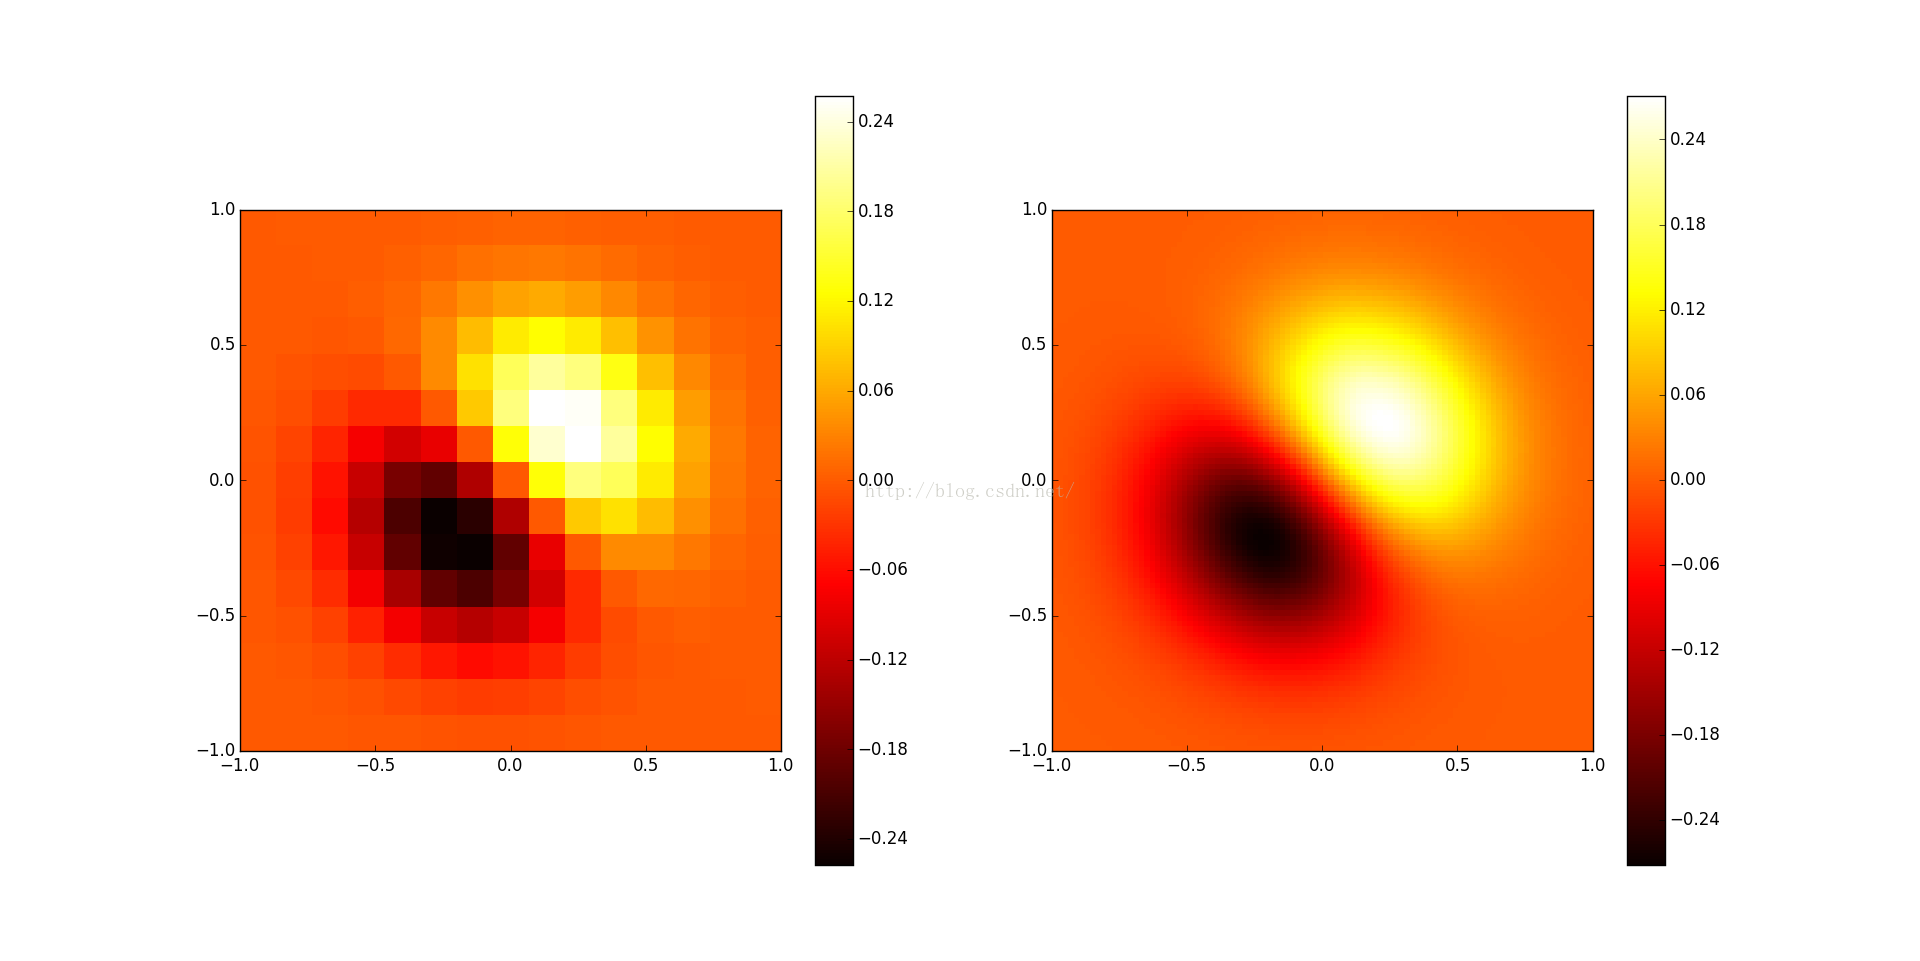
方法与一维数据插值类似,为二维样条插值。
# -*- coding: utf-8 -*-
"""
演示二维插值。
"""
import numpy as np
from scipy import interpolate
import pylab as pl
import matplotlib as mpl

def func(x, y):
 return (x+y)*np.exp(-5.0*(x**2 + y**2))

# X-Y轴分为15*15的网格
y,x= np.mgrid[-1:1:15j, -1:1:15j]

fvals = func(x,y) # 计算每个网格点上的函数值 15*15的值
print len(fvals[0])

#三次样条二维插值
newfunc = interpolate.interp2d(x, y, fvals, kind='cubic')

# 计算100*100的网格上的插值
xnew = np.linspace(-1,1,100)#x
ynew = np.linspace(-1,1,100)#y
fnew = newfunc(xnew, ynew)#仅仅是y值 100*100的值

# 绘图
# 为了更明显地比较插值前后的区别,使用关键字参数interpolation='nearest'
# 关闭imshow()内置的插值运算。
pl.subplot(121)
im1=pl.imshow(fvals, extent=[-1,1,-1,1], cmap=mpl.cm.hot, interpolation='nearest', origin="lower")#pl.cm.jet
#extent=[-1,1,-1,1]为x,y范围 favals为
pl.colorbar(im1)

pl.subplot(122)
im2=pl.imshow(fnew, extent=[-1,1,-1,1], cmap=mpl.cm.hot, interpolation='nearest', origin="lower")
pl.colorbar(im2)
pl.show()

左图为原始数据,右图为二维插值结果图。
二维插值的三维展示方法
# -*- coding: utf-8 -*-
"""
演示二维插值。
"""
# -*- coding: utf-8 -*-
import numpy as np
from mpl_toolkits.mplot3d import Axes3D
import matplotlib as mpl
from scipy import interpolate
import matplotlib.cm as cm
import matplotlib.pyplot as plt

def func(x, y):
 return (x+y)*np.exp(-5.0*(x**2 + y**2))

# X-Y轴分为20*20的网格
x = np.linspace(-1, 1, 20)
y = np.linspace(-1,1,20)
x, y = np.meshgrid(x, y)#20*20的网格数据

fvals = func(x,y) # 计算每个网格点上的函数值 15*15的值

fig = plt.figure(figsize=(9, 6))
#Draw sub-graph1
ax=plt.subplot(1, 2, 1,projection = '3d')
surf = ax.plot_surface(x, y, fvals, rstride=2, cstride=2, cmap=cm.coolwarm,linewidth=0.5, antialiased=True)
ax.set_xlabel('x')
ax.set_ylabel('y')
ax.set_zlabel('f(x, y)')
plt.colorbar(surf, shrink=0.5, aspect=5)#标注

#二维插值
newfunc = interpolate.interp2d(x, y, fvals, kind='cubic')#newfunc为一个函数

# 计算100*100的网格上的插值
xnew = np.linspace(-1,1,100)#x
ynew = np.linspace(-1,1,100)#y
fnew = newfunc(xnew, ynew)#仅仅是y值 100*100的值 np.shape(fnew) is 100*100
xnew, ynew = np.meshgrid(xnew, ynew)
ax2=plt.subplot(1, 2, 2,projection = '3d')
surf2 = ax2.plot_surface(xnew, ynew, fnew, rstride=2, cstride=2, cmap=cm.coolwarm,linewidth=0.5, antialiased=True)
ax2.set_xlabel('xnew')
ax2.set_ylabel('ynew')
ax2.set_zlabel('fnew(x, y)')
plt.colorbar(surf2, shrink=0.5, aspect=5)#标注

plt.show()

左图的二维数据集的函数值由于样本较少,会显得粗糙。而右图对二维样本数据进行三次样条插值,拟合得到更多数据点的样本值,绘图后图像明显光滑多了。
以上就是本文的全部内容,希望对大家的学习有所帮助,也希望大家多多支持脚本之家。
